. 2012 Sep 25;22(18):1681-7.
doi: 10.1016/j.cub.2012.06.068. Epub 2012 Aug 16.

Estimating the microtubule GTP cap size in vivo

Affiliations

Estimating the microtubule GTP cap size in vivo

Dominique Seetapun et al. Curr Biol. .

Abstract

Microtubules (MTs) polymerize via net addition of GTP-tubulin subunits to the MT plus end, which subsequently hydrolyze to GDP-tubulin in the MT lattice. Relatively stable GTP-tubulin subunits create a "GTP cap" at the growing MT plus end that suppresses catastrophe. To understand MT assembly regulation, we need to understand GTP hydrolysis reaction kinetics and the GTP cap size. In vitro, the GTP cap has been estimated to be as small as one layer (13 subunits) or as large as 100-200 subunits. GTP cap size estimates in vivo have not yet been reported. Using EB1-EGFP as a marker for GTP-tubulin in epithelial cells, we find on average (1) 270 EB1 dimers bound to growing MT plus ends, and (2) a GTP cap size of ∼750 tubulin subunits. Thus, in vivo, the GTP cap is far larger than previous estimates in vitro, and ∼60-fold larger than a single layer cap. We also find that the tail of a large GTP cap promotes MT rescue and suppresses shortening. We speculate that a large GTP cap provides a locally concentrated scaffold for tip-tracking proteins and confers persistence to assembly in the face of physical barriers such as the cell cortex.


Figures

Figure 1
Figure 1. EB1-EGFP Exists as a Dimer in LLCPK1 Epithelial Cells
(A) EB1-EGFP labels growing MT plus ends in LLCPK1 epithelial cells. EB1-EGFP LLCPK1 stable cell line transiently expressing mCherry-α-tubulin. (A, upper left) Individual growing MTs observed near the periphery of the cell have EB1-EGFP comets at their tips. (A, bottom panels) Kymographs in the mCherry-α-tubulin and EB1-EGFP channels corresponding to the MT in the white box. (A, upper right) Merged kymograph with tubulin and EB1 in the red and green channels, respectively. (B) Montage of a FRAP experiment in the cytoplasm of an EB1-EGFP expressing LLCPK1 cell. Individual examples of experimental FRAP recovery curves for EGFP, 2xEGFP, EB1-EGFP and EGFP-α-tubulin are shown. (C-D) The diffusion coefficient of EB1-EGFP is consistent with a dimer. (C) Diffusion coefficients were determined from simulations of FRAP experiments by quantitatively comparing experimental and simulated recovery halftimes. The theoretical dependence of the diffusion coefficient on the molecular weight (MW) is based on Stokes-Einstein-Sutherland theory for a spherical particle. The diffusion coefficient of EB1-EGFP is similar to that of EGFP-α-tubulin (MW = 140 kDa), but different from that of 2xEGFP (MW = 60 kDa). (D) Further FRAP experiments show that cytoplasmic EB1-EGFP and 2xEGFP diffuse at significantly different rates, consistent with EB1-EGFP diffusing as a dimer in LLCPK1 cells. All error bars are s.e.m.
Figure 2
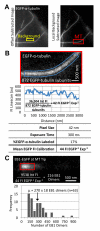
Figure 2. An Average of 270 EB1 Dimers are at the Growing MT Plus End
(A) Individual MTs observed near the periphery of LLCPK1α cells. (A, left) The local background (yellow box) near the MT is subtracted to yield a section of MT lattice that is free of MT-unrelated signal. A section of the background-subtracted MT (red box) is analyzed in (B). (B) Calibrating the fluorescence intensity (FI) of a single EGFP molecule in vivo. A linescan along the MT (blue box), encompassing the width of the MT, is taken to measure the integrated FI of the MT region. The corresponding linescan and integrated FI are shown below. From the known MT packing and percentage of labeled tubulin in the cell (17%), the brightness of a single EGFP molecule was calculated to be 44 FI·EGFP−1·exposure−1. Relevant experimental parameters for calibrating the brightness of a single EGFP molecule are shown in the table. (C) Determining the number of EB1 dimers in an EB1-EGFP comet. An ROI of fixed size (see Experimental Procedures) is used to calculate the integrated FI of the comet, which is then used to determine the number of EB1 dimers based on the EGFP brightness calibration. The example EB1-EGFP comet shown has 216 EB1 dimers. A histogram of the number of EB1 dimers in a comet is shown below with the mean and s.e.m indicated.
Figure 3
Figure 3. The MT GTP Cap is Composed of 750 GTP-Tubulin Subunits In Vivo
(A) Determining the number of GTP-tubulin subunits in the GTP cap. The EB1 percent occupancy was measured at the tip of the MT plus end. First, the brightest pixel in an experimental EB1-EGFP comet was found using a custom MATLAB code. Then, a 1 × 7 pixel region of interest (ROI; red box) was centered on the brightest pixel and the integrated FI within the region was calculated. Next, using the brightness calibration of a single EGFP, the corresponding number of EB1 dimers within the ROI was calculated. Then, the EB1 percent occupancy was calculated by dividing the number of EB1 dimers by the tubulin packing density. Finally, the number of GTP-tubulin subunits was calculated by dividing the average number of EB1 dimers in an EB1 comet (Figure 2C) by the fractional occupancy to yield ~800 GTP-tubulin subunits in the GTP cap. (B) MT animation showing the distributed GTP cap. Only the first 50 layers are shown of the 800 subunit cap. Purple and white dimers represent GTP-tubulin subunits while green and white dimers represent GDP-tubulin subunits. The corresponding model-convolved fluorescent image is shown below. The red box indicates the same size region as shown in (A). The blue box corresponds to the same length indicated by the blue box in (A) and in the model-convolved image. (C) Example EB1 comet from an EB1-EGFP LLCPK1 cell and the corresponding fluorescence intensity (FI) linescan, blue line. Exponential decay fit (red line) to EB1 comet signal is shown. The average EB1 comet decay length (λ) and halflength (L1/2) are shown with the calculation of the GTP cap size using the EB1 comet halflength. This alternative method for estimating the MT GTP cap size yields an estimate that is consistent with the GTP cap size estimate from the EGFP calibration method (A).
Figure 4
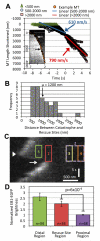
Figure 4. Suppressed MT Shortening and MT Rescues are Correlated with Increased EB1-EGFP
(A) MTs shorten slower through the GTP cap. Kymographs from timelapse movies of EGFP-α-tubulin MTs were used to determine that MTs shorten more slowly 500-2000 nm away from the MT tip (610 ± 34 nm/s, blue line) as compared to >2000 nm away from the MT tip (790 ± 54 nm/s, red line; mean ± s.e.m., n=31 MTs; p=0.003 by paired Student’s t-test). The MT region <500 nm away from the MT tip was considered to be within the GTP-tubulin rich region (i.e. within ~one decay length of the average GTP cap size), and was not included in the analysis (green triangles). An example trace of a shortening MT is plotted (orange circles) on the corresponding kymograph (see inset). The start of the 500-2000 nm section (white arrow) and the >2000 nm (black arrow) section are indicated. (B) MT rescues occur on average 1200 ± 95 nm (mean±s.e.m., n=34 MTs) from the plus end of the MT. The mean rescue site is ~150 layers away from the tip of the MT, which is inconsistent with a single layer GTP cap but consistent with a large GTP cap with a long tail. (C) Measuring EB1-EGFP FI signal during MT rescue events. An example EB1-EGFP comet kymograph from a live time-lapse movie is shown. It contains a catastrophe (arrow head) followed by a rescue event 714 nm away and 5 s later (arrow indicates time-point of rescue). To determine if MT rescue sites have more GTP-tubulin than non-rescue sites, the EB1-EGFP FI at the rescue site (1, red box) was compared to the FI at a proximal region (2, purple dotted box) and distal region (5, green box). For further analysis the proximal site (2) was divided into left (3) and right (4) proximal regions. (D) MT rescues occur at sites with relatively high levels of EB1-EGFP. The rescue site was significantly brighter than the proximal regions but not brighter than the distal region, by multiple comparison test, which is consistent with a large GTP cap but inconsistent with a GTP remnant or a single-layer cap. Error bars are s.e.m.

Comment in

References

    1. O’Brien ET, Voter WA, Erickson HP. GTP hydrolysis during microtubule assembly. Biochemistry. 1987;26:4148. - PubMed
    1. Panda D, Miller HP, Wilson L. Determination of the Size and Chemical Nature of the Stabilizing “Cap” at Microtubule Ends Using Modulators of Polymerization Dynamics. Biochemistry. 2002;41:1609. - PubMed
    1. Caplow M, Shanks J. Evidence that a single monolayer tubulin-GTP cap is both necessary and sufficient to stabilize microtubules. Mol Biol Cell. 1996;7:663–675. - PMC - PubMed
    1. Walker RA, Pryer NK, Salmon ED. Dilution of individual microtubules observed in real time in vitro: evidence that cap size is small and independent of elongation rate. The Journal of Cell Biology. 1991;114:73–81. - PMC - PubMed
    1. Martin SR, Bayley PM. Effects of GDP on microtubules at steady state. Biophysical Chemistry. 1987;27:67–76. - PubMed

Publication types

MeSH terms