. 2012 Sep;44(9):1015-9.
doi: 10.1038/ng.2368. Epub 2012 Aug 19.

Evidence of widespread selection on standing variation in Europe at height-associated SNPs

Affiliations

Evidence of widespread selection on standing variation in Europe at height-associated SNPs

Michael C Turchin et al. Nat Genet. 2012 Sep.

Abstract

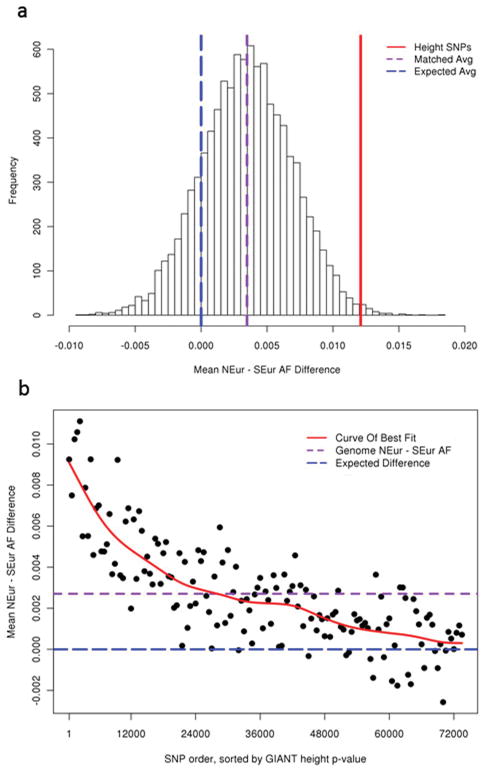
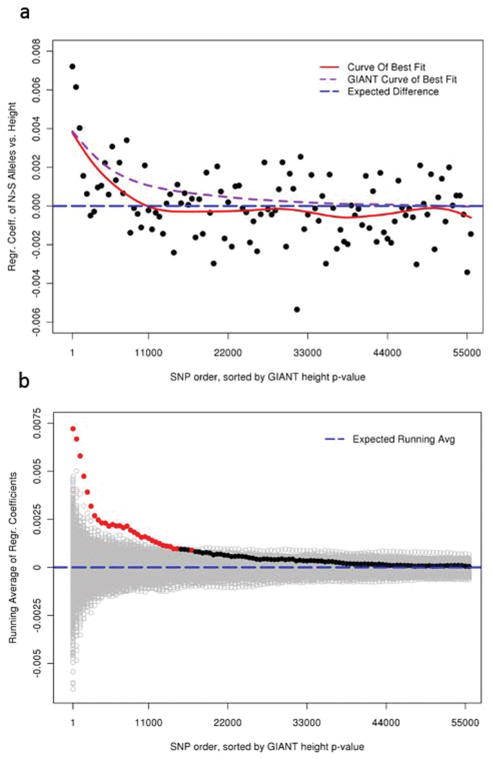
Strong signatures of positive selection at newly arising genetic variants are well documented in humans(1-8), but this form of selection may not be widespread in recent human evolution(9). Because many human traits are highly polygenic and partly determined by common, ancient genetic variation, an alternative model for rapid genetic adaptation has been proposed: weak selection acting on many pre-existing (standing) genetic variants, or polygenic adaptation(10-12). By studying height, a classic polygenic trait, we demonstrate the first human signature of widespread selection on standing variation. We show that frequencies of alleles associated with increased height, both at known loci and genome wide, are systematically elevated in Northern Europeans compared with Southern Europeans (P < 4.3 × 10(-4)). This pattern mirrors intra-European height differences and is not confounded by ancestry or other ascertainment biases. The systematic frequency differences are consistent with the presence of widespread weak selection (selection coefficients ∼10(-3)-10(-5) per allele) rather than genetic drift alone (P < 10(-15)).


Conflict of interest statement

Author Information

The authors declare no competing financial interests

Figures

Figure 1
Figure 1. Mean allele frequency difference of height SNPs, matched SNPs and genome-wide SNPs between Northern- and Southern-European populations
a, Mean frequency difference of the height-increasing alleles from 139 known height SNPs in MIGen (solid red line) are compared against that of 10,000 sets of randomly-drawn SNPs, with each set matched by average Northern- and Southern-European allele frequencies to the known height SNPs on a per-SNP basis. Shown in purple is the mean value across the 10,000 sets of matched SNPs, and in blue is the expected mean difference for the sets of matched SNPs (x=0). b, Mean frequency difference of the height-increasing allele for sets of 500 independent (r2 < 0.1) SNPs across the genome. SNPs were sorted by GIANT height association p-value. Shown in red is the curve of best fit, in purple the genome-wide mean frequency difference, and in blue the expected mean difference (y=0). U.S. individuals of Northern-European ancestry and Spanish individuals from the MIGen dataset were used. NEur, Northern European. SEur, Southern European. AF, allele frequency.
Figure 2
Figure 2. Within-family analyses of height and the Northern-predominant alleles across the genome
Ordered by GIANT height association p-values, height was regressed against the number of Northern-predominant alleles for each SNP, using data from a total of 4,819 individuals in 1,761 sibships. Height and allele counts were both normalized within sibships. a, The average regression coefficients in groups of 500 SNPs are plotted on the y-axis. The SNP ranks are plotted on the x-axis. The red line is the curve of best fit; purple dashed line is the directly comparable curve of best fit for the GIANT effect sizes; blue dashed line is y=0. b, The running averages of the regression coefficients were plotted on the y-axis (red and black filled circles). The running averages of regression coefficients from 1,000 analyses where phenotypes were permuted within sibships are also shown (grey open circles). Observed data points are colored black if they are less extreme than 0.01% of the permuted values. The blue dashed line is y=0.

References

    1. Tishkoff SA, et al. Haplotype diversity and linkage disequilibrium at human G6PD: recent origin of alleles that confer malarial resistance. Science. 2001;293:455–62. - PubMed
    1. Hamblin MT, Di Rienzo A. Detection of the signature of natural selection in humans: evidence from the Duffy blood group locus. Am J Hum Genet. 2000;66:1669–79. - PMC - PubMed
    1. Bersaglieri T, et al. Genetic signatures of strong recent positive selection at the lactase gene. Am J Hum Genet. 2004;74:1111–20. - PMC - PubMed
    1. The International HapMap Consortium et al. A second generation human haplotype map of over 3.1 million SNPs. Nature. 2007;449:851–61. - PMC - PubMed
    1. Sabeti PC, et al. Genome-wide detection and characterization of positive selection in human populations. Nature. 2007;449:913–8. - PMC - PubMed

Publication types