. 2012 Oct;42(10):2697-708.
doi: 10.1002/eji.201242370. Epub 2012 Aug 20.

The role of 1α,25-dihydroxyvitamin D3 and cytokines in the promotion of distinct Foxp3+ and IL-10+ CD4+ T cells

Affiliations

The role of 1α,25-dihydroxyvitamin D3 and cytokines in the promotion of distinct Foxp3+ and IL-10+ CD4+ T cells

Zoë Urry et al. Eur J Immunol. 2012 Oct.

Abstract

1α,25-Dihydroxyvitamin D3 (1α25VitD3) has potent immunomodulatory properties. We have previously demonstrated that 1α25VitD3 promotes human and murine IL-10-secreting CD4(+) T cells. Because of the clinical relevance of this observation, we characterized these cells further and investigated their relationship with Foxp3(+) regulatory T (Treg) cells. 1α25VitD3 increased the frequency of both Foxp3(+) and IL-10(+) CD4(+) T cells in vitro. However, Foxp3 was increased at high concentrations of 1α25VitD3 and IL-10 at more moderate levels, with little coexpression of these molecules. The Foxp3(+) and IL-10(+) T-cell populations showed comparable suppressive activity. We demonstrate that the enhancement of Foxp3 expression by 1α25VitD3 is impaired by IL-10. 1α25VitD3 enables the selective expansion of Foxp3(+) Treg cells over their Foxp3(-) T-cell counterparts. Equally, 1α25VitD3 maintains Foxp3(+) expression by sorted populations of human and murine Treg cells upon in vitro culture. A positive in vivo correlation between vitamin D status and CD4(+) Foxp3(+) T cells in the airways was observed in a severe pediatric asthma cohort, supporting the in vitro observations. In summary, we provide evidence that 1α25VitD3 enhances the frequency of both IL-10(+) and Foxp3(+) Treg cells. In a translational setting, these data suggest that 1α25VitD3, over a broad concentration range, will be effective in enhancing the frequency of Treg cells.


Figures

Figure 1
Figure 1
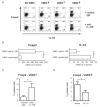
1α25VitD3 increases the frequency of IL-10+ and Foxp3+ human CD4+ T cells. Human CD4+ T cells were stimulated for two 7-day cycles with anti-CD3, IL-2, and IL-4 (No VitD3) or additionally with the indicated concentration of 1α25VitD3 (VitD3; 10× M). (A) At day 14, cells were restimulated for 16 h with anti-CD3 and IL-2. IL-10+ cells were identified using an IL-10 secretion assay kit. FoxP3+ cells were assessed by intranuclear staining. Values represent the percentage of gated live CD4+ cells. Each symbol represents an individual donor and lines represent the mean. *p < 0.05 as determined by the Mann–Whitney rank sum test. (B) Cells were costained for expression of both IL-10 and FoxP3 in the presence of 10−7 M 1α25VitD3. Two representative flow cytometry plots from different donors are shown. Note the absence of FoxP3+IL-10+ cells. Data are representative of seven independent experiments. (C) Data from the costaining experiments are depicted in a correlation analysis. R2 value was determined by Spearman’s rank correlation coefficient. Each symbol represents a different donor (n = 8); closed symbols = 10−6 M 1α25VitD3, open symbols = 10−7 M 1α25VitD3.
Figure 2
Figure 2
1α25VitD3-treated CD4+ T-cell populations acquire suppressive properties. (A) Autologous CD45RA+ T cells were isolated, CFSE-labeled, and co-cultured with the cell lines (No VitD3 or VitD3, as indicated) at a ratio of 2:1 responder to cell line, for 5 days with anti-CD3 and CD28. The percentage of proliferating, viable CFSE-labeled responders is shown, as assessed by flow cytometry. Data are shown as mean ± SEM from four independent experiments from different healthy donors. *p < 0.05 as determined by the Mann–Whitney rank sum test. (B) CFSE-labeled ± responder cells were co-cultured with cell lines — (i) VitD3 10−6M T cells, (ii) VitD3 10−7M T cells–at the ratios indicated in the graph, in the presence of control IgG (closed symbols) or anti-IL-10R (hollow symbols); both at 5 μg/mL. Data are representative of four independent experiments.
Figure 3
Figure 3
1α25VitD3 promotes the expression of Treg-cell-associated surface markers. Human CD4+ T cells were stimulated alone (No VitD3) or additionally in the presence of the indicated molar concentrations of 1α25VitD3 (VitD3). At day 14, cells were stained and analyzed for the surface expression of CD25, CD38, PD-1, CTLA-4, CD62L, and GITR (black lines; gray lines = matched isotype control) by flow cytometry. For PD-1 and CTLA-4, values represent percentage of positive cells; all other antigens values shown are indicative of the geometric mean fluorescence intensity. Data are representative of a minimum of six independent experiments.
Figure 4
Figure 4
The enhancement of Foxp3 expression by 1α25VitD3 is impaired by IL-10.Human CD4+ T cells were cultured for two 7 day cycles with anti-CD3, IL-2, and IL-4 (No VitD3) or additionally with the indicated concentration of 1α25VitD3 (VitD3; 10× M) in the presence of IL-10, anti-IL-10R, or control IgG, as indicated. (A) At day 14, cells were re-stimulated for 16 h with anti-CD3 and IL-2. IL-10+ cells were determined using a commercially available IL-10 secretion assay and subsequently stained for intranuclear expression of Foxp3. Values represent the percentage of gated live cells. (B) Foxp3 and IL-10 gene expression, as determined by real time RT-PCR. Data are shown normalized to an endogenous control (18s rRNA) and expressed relative to IgG control-treated cells. Data are shown as mean +SEM from four independent experiments from different healthy donors. (C) CD4+ T cells were cultured with a concentration of 10−7 M 1α25VitD3 (VitD3) in the presence of control IgG or anti-IL-10R. Foxp3 expression was determined by intranuclear staining for Foxp3. (D) CD4+ T cells were cultured with a concentration of 10−6 M 1α25VitD3 (VitD3) in the presence or absence of IL-10. Foxp3 expression was determined by intranuclear staining for Foxp3. (C and D) Data are shown as mean +SEM of four experiments each performed with an individual donor. *p < 0.05 as determined by the Mann–Whitney rank sum test.
Figure 5
Figure 5
Human CD4+CD25+ T cells retain Foxp3 expression in the presence of 1α25VitD3. (A) Human CD4+CD25high Treg cells were sorted from CD4+ T cells by flow cytometry. Foxp3 expression is depicted in the overlay histogram on the right.(B) Sorted CD4+CD25+ cells were cultured with anti-CD3 and IL-2 (50 U/mL) in the absence (No VitD3) or the presence of 10−7 M or 10−6 M 1α25VitD3 (VitD3) as indicated for 7 days and then assessed for expression of CD25 and Foxp3 by flow cytometry. Data are representative of three independent experiments each performed with a different healthy donor.
Figure 6
Figure 6
1α25VitD3 favors the proliferation of Foxp3+ over Foxp3- T cells.(A) Human CD4+ T cells were labeled with CellTraceTM Violet and then cultured for one or two 7-day cycles with anti-CD3, IL-2 (No VitD3), or additionally with the indicated concentration of 1α25VitD3 (VitD3; 10× M). At day 7 and 14, cells were stained for Foxp3 and analyzed by flow cytometry. Proliferation was assessed by loss of expression of CellTrace with each cell division. (B) (i) Representative histograms showing CellTrace expression in Foxp3 (filled histogram) and Foxp3+ (open histogram) T cells at day 14. Note the peaks represent successive generations of cells. (ii) Data from day 7 (n = 7) and day 14 (n = 4) of the percentage of original population divided are shown as mean ± SEM of the indicated number of experiments. *p < 0.05 as determined by the Mann–Whitney rank sum test. (C) Overlay histograms from a representative donor showing CellTrace expression in individually labeled Treg or T-effector populations that were then co-cultured with the nonlabeled population for 14 days at the original ratio of 1:9 in the absence or presence of 1α25VitD3 as indicated. Filled histograms show proliferation of labeled Treg cells that were co-cultured with unlabeled T-effector cells. Open histograms assess proliferation of labeled T-effector cells, co-cultured with unlabelled Treg cells. (D) Data from (C) presented as percentage of original population divided. Representative data from three independent experiments each performed with different donors are shown.
Figure 7
Figure 7
Serum 25-hydroxyvitamin D3 correlates with the frequency of CD4+ FoxP3+ cells in BAL of pediatric asthma patients. Pediatric patients with severe therapy resistant asthma (STRA) were analyzed for the presence of Treg cells (percentage of CD4+ cells expressing Foxp3) in bronchoaveolar lavage fluid. Serum was collected from the same patients and the concentration of the circulating form of vitamin D3, 25-hydroxyvitamin D3 was assessed by two-dimensional high performance liquid chromatography system–tandem mass spectrometry. Each point represents an individual patient from 11 experiments performed.The r and p values were assessed using Pearson’s correlation test.

References

    1. Sakaguchi S, Miyara M, Costantino CM, Hafler DA. FOXP3+ regulatory T cells in the human immune system. Nat. Rev. Immunol. 2010;10:490–500. - PubMed
    1. Hawrylowicz CM. Regulatory T cells and IL-10 in allergic inflammation. J. Exp. Med. 2005;202:1459–1463. - PMC - PubMed
    1. Adorini L, Penna G. Dendritic cell tolerogenicity: a key mechanism in immunomodulation by vitamin D receptor agonists. Hum. Immunol. 2009;70:345–352. - PubMed
    1. Penna G, Roncari A, Amuchastegui S, Daniel KC, Berti E, Colonna M, Adorini L. Expression of the inhibitory receptor ILT3 on dendritic cells is dispensable for induction of CD4+Foxp3+ regulatory T cells by 1,25-dihydroxyvitamin D3. Blood. 2005;106:3490–3497. - PubMed
    1. Unger WW, Laban S, Kleijwegt FS, van der Slik AR, Roep BO. Induction of Treg by monocyte-derived DC modulated by vitamin D3 or dexamethasone: differential role for PD-L1. Eur. J. Immunol. 2009;39:3147–3159. - PubMed

Publication types

MeSH terms