. 2012:542-545.
doi: 10.1109/ISBI.2012.6235605.

DISCOVERY OF GENES THAT AFFECT HUMAN BRAIN CONNECTIVITY: A GENOME-WIDE ANALYSIS OF THE CONNECTOME

Affiliations

DISCOVERY OF GENES THAT AFFECT HUMAN BRAIN CONNECTIVITY: A GENOME-WIDE ANALYSIS OF THE CONNECTOME

Neda Jahanshad et al. Proc IEEE Int Symp Biomed Imaging. 2012.

Abstract

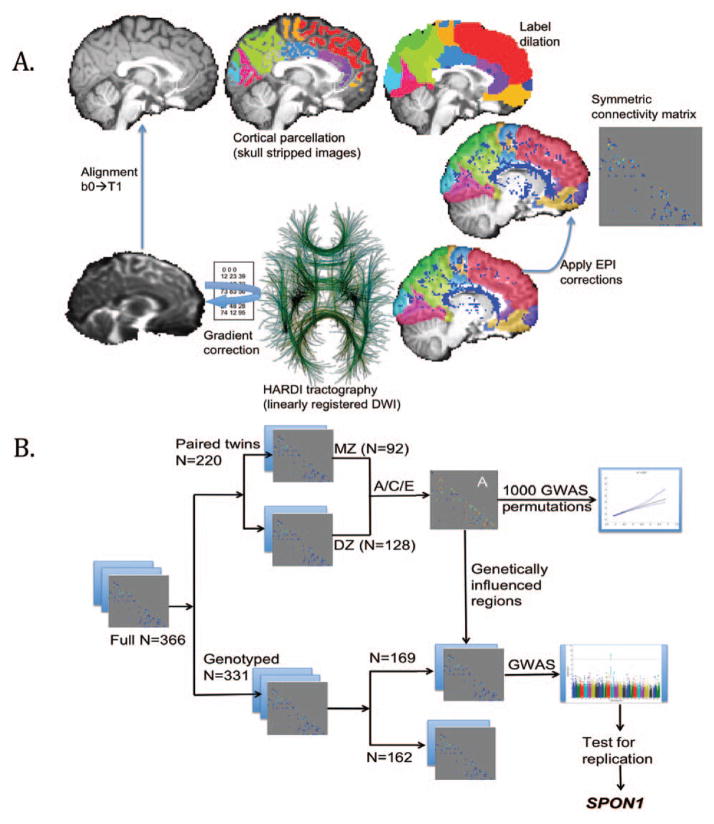
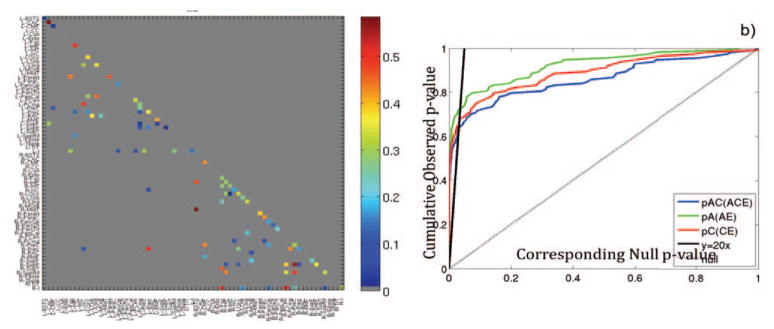
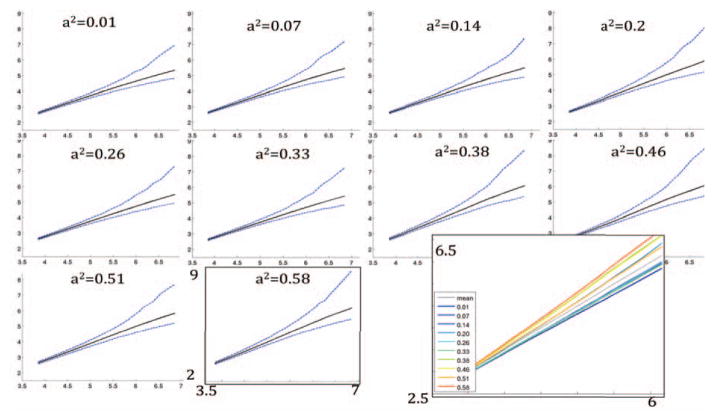
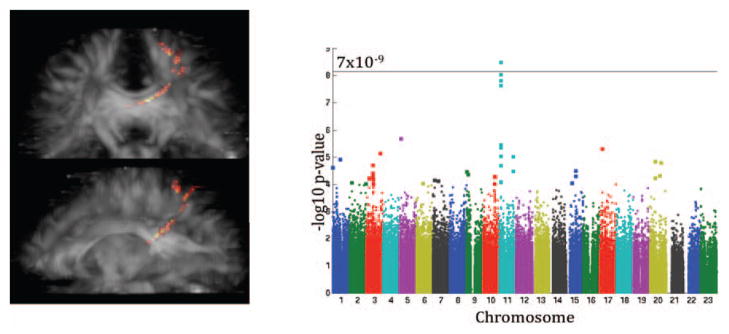
Human brain connectivity is disrupted in a wide range of disorders - from Alzheimer's disease to autism - but little is known about which specific genes affect it. Here we conducted a genome-wide association for connectivity matrices that capture information on the density of fiber connections between 70 brain regions. We scanned a large twin cohort (N=366) with 4-Tesla high angular resolution diffusion imaging (105-gradient HARDI). Using whole brain HARDI tractography, we extracted a relatively sparse 70×70 matrix representing fiber density between all pairs of cortical regions automatically labeled in co-registered anatomical scans. Additive genetic factors accounted for 1-58% of the variance in connectivity between 90 (of 122) tested nodes. We discovered genome-wide significant associations between variants and connectivity. GWAS permutations at various levels of heritability, and split-sample replication, validated our genetic findings. The resulting genes may offer new leads for mechanisms influencing aberrant connectivity and neurodegeneration.


Figures

Figure 1
Figure 1
a) NxN connectivity matrix design workflow; b) workflow for genetic association analysis in independent non-overlapping samples (for split-sample replication of genetic hits).
Figure 2
Figure 2
Genetic analysis of a sample of 46 monozygotic twin pairs and 64 dizygotic twin pairs, through the A/C/E structural equation model, breaks down the observed variance in structural neural connectivity into variance components describing the contribution of additive genetic effects (A), shared environmental effects (C), and unique individual variance or measurement error (E). For nodes where the A/C/E model fits the data well, the value of a2 is shown for each node in a). Regions are only displayed if a2 was higher than 1%. We show through cumulative distribution function (CDF) plots, b), that the A/C/E model significantly improves upon the E model (the model derived if we assume the entire brain network is attributable to unique environmental attributes); the A/E and C/E models each fit better than the E model.
Figure 3
Figure 3
At connections with increasing levels of heritability, from 1% to 58% (a–j), 1000 GWASs were conducted on permutations of the twin NxN matrices used for the A/C/E heritability analysis. The −log10 of the lowest 1000 p-values of each permutation are plotted against the −log10 expected ordered p-values for the same number of tests. The solid black line represents the mean of the ordered p-values, while the dashed blue lines represent the 0.025 and 0.975 point-wise quantiles of the ordered p-values. The mean of the ordered p-values of all the 10 plots (solid black line in each), are plotted together in k) against the −log10 expected ordered p-values. −log10 p-values tend to be higher as heritability of the trait is increased, suggesting the benefits of pre-screening connections for heritability, before running GWAS.
Figure 4
Figure 4
A genome-wide significant association to connectivity was found in Group 1 (Ndiscovery=169) and replicated in an independent sample, Group 2 (Nreplication=162). The association was found for the density of connections between the left posterior cingulate and the left superior parietal lobe, shown in a). The Manhattan plot of the GWAS of this connection is shown in b). The threshold for significance was set to 7×10⁻⁹ (see text for justification).
Figure 5
Figure 5
In the full group (N=331), we conducted a GWAS at every connection, leading to two genetic loci reaching genome-wide significance (p < 7×10⁻⁹) at two connections. Manhattan plots are shown for the a) connection between the L superior parietal cortex and the L posterior cingulate where variants in SPON1 were significant, b) connection between the R superior parietal cortex and R post-central cortex, where DLGAP2 was found to have genome-wide significant associations.

References

    1. Jolles DD, et al. A comprehensive study of whole-brain functional connectivity in children and young adults. Cereb Cortex. 2011 Feb;21:385–91. - PubMed
    1. Thomason ME, Thompson PM. Diffusion imaging, white matter, and psychopathology. Annu Rev Clin Psychol. 2011 Apr;7:63–85. - PubMed
    1. Chiang MC, et al. Genetics of brain fiber architecture and intellectual performance. J Neurosci. 2009;29:2212–24. - PMC - PubMed
    1. Jahanshad N, et al. Genetic influences on brain asymmetry: a DTI study of 374 twins and siblings. Neuroimage. 2010 Aug 15;52:455–69. - PMC - PubMed
    1. Thompson PM, et al. Genetic influences on brain structure. Nat Neurosci. 2001 Dec;4:1253–8. - PubMed

LinkOut - more resources