

Trans fatty acid intakes and food sources in the U.S. population: NHANES 1999-2002
- PMID: 22903556
- PMCID: PMC3449059
- DOI: 10.1007/s11745-012-3704-z
Trans fatty acid intakes and food sources in the U.S. population: NHANES 1999-2002
Abstract
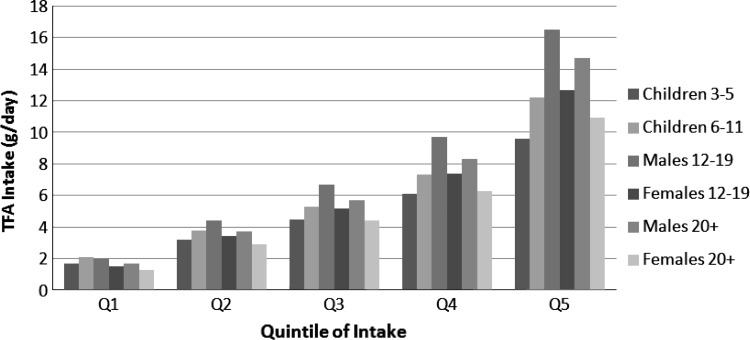
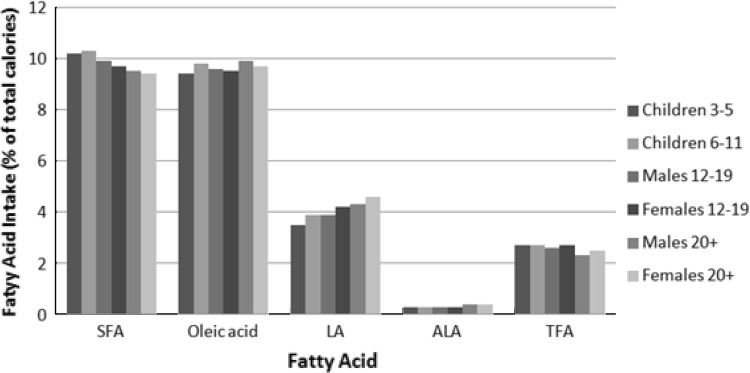
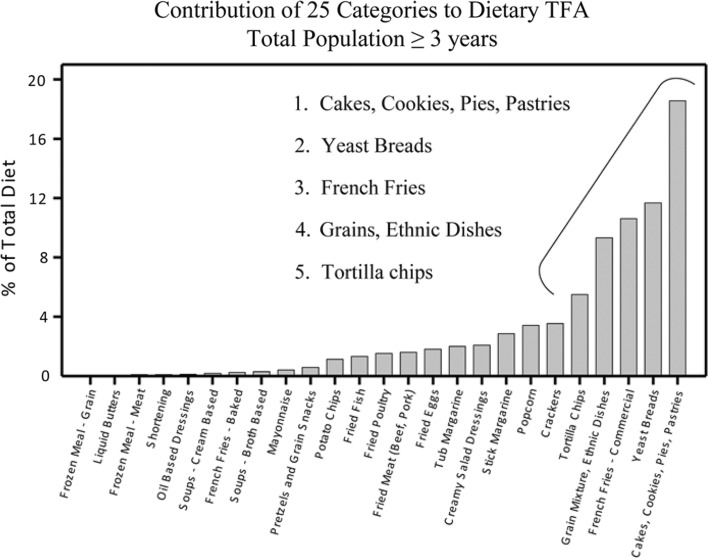
Because of efforts to decrease trans fatty acids (TFA) in the food supply, intake should be assessed in the population to establish a baseline TFA intake. The 1999-2002 National Health and Nutrition Examination Survey (NHANES) was used to identify a benchmark for TFA intake. TFA was estimated by mean, median, and quintile of intake, TFA intake data were weighted using the NHANES 4-year sample weights. The main outcome measures included TFA intake in grams per day and percentage of energy in the top 25 food sources of TFA. Data are reported for 16,669 individuals ≥ 3 years of age. Median TFA intake was 2.3 % of calories (5 g/day) with 0.9-4.5 % of energy (1.5-13.1 g/day) over different quintiles of intake. Mean TFA intake was 2.5 % of energy (6.1 g/day). The range of TFA intake in the fifth quintile was very large, i.e., 3.5-12.5 % of energy or 8.8-92.4 g/day. Increasing quintiles of TFA intake were associated with increases in total fat (26.7-37.6 % of energy), saturated fat (7.6-10.5 % of energy), and calories (for those >20 years of age: 2,416-2,583 for men and 1,679-1,886 for women). Major food sources of dietary TFA were cakes, cookies, pies, and pastries. Based on current dietary guidance to consume as little industrial TFA as possible, much progress is needed to attain this goal, including food industry efforts to remove TFA from the food supply and educating the public about making healthy food choices.
Figures
References
-
- U.S. Department of Agriculture, U.S. Department of Health and Human Services (2010) Dietary guidelines for Americans, 2010. http://www.cnpp.usda.gov/DGAs2010-PolicyDocument.htm. Accessed 28 July 2011
-
- Food and Agriculture Organization of the United Nations (2010) Fats and fatty acids in human nutrition: report of an expert consultation. http://foris.fao.org/preview/25553-0ece4cb94ac52f9a25af77ca5cfba7a8c.pdf. Accessed 28 July 2011
Publication types
MeSH terms
Substances
LinkOut - more resources
Full Text Sources
