Review
. 2012 Sep;36(3):529-42.
doi: 10.1002/jmri.23605.

Cardiac imaging techniques for physicians: late enhancement

Affiliations
Review

Cardiac imaging techniques for physicians: late enhancement

Peter Kellman et al. J Magn Reson Imaging. 2012 Sep.

Abstract

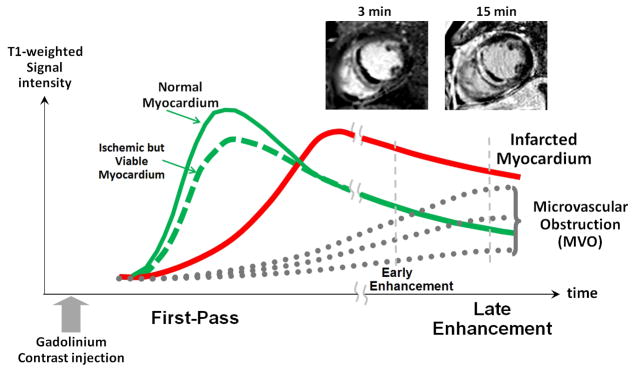
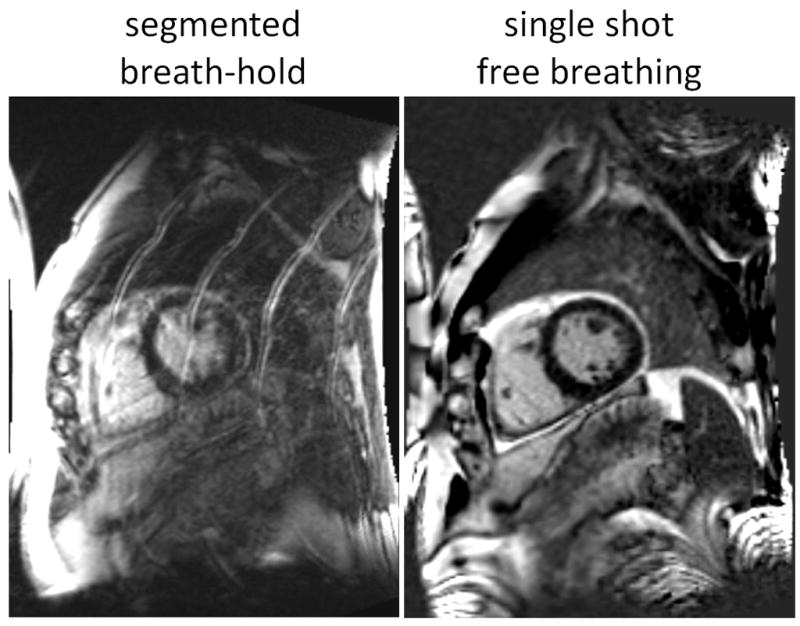
Late enhancement imaging is used to diagnose and characterize a wide range of ischemic and nonischemic cardiomyopathies, and its use has become ubiquitous in the cardiac MR exam. As the use of late enhancement imaging has matured and the span of applications has widened, the demands on image quality have grown. The characterization of subendocardial MI now includes the accurate quantification of scar size, shape, and characterization of borders which have been shown to have prognostic significance. More diverse patterns of late enhancement including patchy, mid-wall, subepicardial, or diffuse enhancement are of interest in diagnosing nonischemic cardiomyopathies. As clinicians are examining late enhancement images for more subtle indication of fibrosis, the demand for lower artifacts has increased. A range of new techniques have emerged to improve the speed and quality of late enhancement imaging including: methods for acquisition during free breathing, and fat water separated imaging for characterizing fibrofatty infiltration and reduction of artifacts related to the presence of fat. Methods for quantification of T1 and extracellular volume fraction are emerging to tackle the issue of discriminating globally diffuse fibrosis from normal healthy tissue which is challenging using conventional late enhancement methods. The aim of this review will be to describe the current state of the art and to provide a guide to various clinical protocols that are commonly used.


Figures

Figure 1
Figure 1
Examples late enhancement images illustrating the a variety of late enhancement patterns (a) sub-endocardial chronic MI, (b) transmural chronic MI, (c) acute MI with dark core due to microvascular obstruction, (d) mid-wall enhancement in patient with myocarditis, (e) sub-epicardial enhancement in patient with myocarditis, (f) patchy appearance of scarring in a patient with HCM.
Figure 2
Figure 2
Signal intensity time course from administration of bolus through late enhancement illustrating slower wash-in and wash-out of Gd contrast into infarcted tissue compared with normal ischemic tissue. Tissue with microvascular obstruction (MVO) experiences very slow wash-in of Gd. The apparent size of MVO region in acute MI shrinks between early (3 min) and late (15 min) enhancement images due to late arrival of Gd.
Figure 3
Figure 3
Illustration of extracellular volume fraction for normal myocardium with intact cell membrane, acute MI with ruptured cell membrane, and chronic MI with collagen matrix.
Figure 4
Figure 4
Signal intensity versus inversion time is plotted for magnitude inversion recovery (MagIR) (left) and phase sensitive inversion recovery (PSIR) (center), and signal difference between MI and normal myocardium (right) illustrates the sensitivity of MagIR to setting the inversion time (TI) to null the normal myocardium. MagIR exhibits a loss of contrast and polarity artifact when the TI is too early, whereas PSIR maintains a similar appearance.
Figure 5
Figure 5
Magnitude IR (top) and PSIR (bottom) reconstructed late enhancement images acquired at a series of TIs illustrating the relative TI insensitivity of PSIR over a wide range.
Figure 6
Figure 6
Timing of inversion recovery for (a) segmented IR with inversions every single R-R interval, (b) with inversions triggered every 2 R-R intervals, and (c) for segmented PSIR with inversions every 2 R-R intervals including acquisition of PD-weighted reference data on alternate heartbeats.
Figure 7
Figure 7
Using inversions every R-R interval leads to incomplete magnetization recovery. Sensitivity to R-R variations in single R-R triggering may lead to image artifacts as well as reduction of signal intensity.
Figure 8
Figure 8
Illustration of respiratory ghost artifacts (left) segmented breath-held late enhancement imaging in situation where patient has difficulty holding their breath which is mitigated using a single-shot free breathing protocol (right).
Figure 9
Figure 9
Respiratory motion corrected averaging of multiple accelerated single shot PSIR-SSFP images acquired during free-breathing may be used to improve the SNR becoming comparable or better than breath-held PSIR FLASH protocols for the same duration acquisition.
Figure 10
Figure 10
Example of PSIR late enhancement using motion corrected averaging with 256×144 matrix and 32 measurements. The diastolic imaging duration is less than 140 ms with parallel imaging acceleration factor 3.
Figure 11
Figure 11
Contrast between MI and blood pool varies with time from gadolinium administration.
Figure 12
Figure 12
Multi-contrast late enhancement (MCODE) acquired PSIR and T2-weighted images in the same breath-held acquisition at the same cardiorespiratory phase to enable discrimination between the blood and MI based on T2. Subject 1 (top) has excellent blood-to-MI contrast, while subject 2 has poor MI-to-blood contrast.
Figure 13
Figure 13
Example of fat water separated PSIR late enhancement illustrating fatty infiltration into chronic MI. Fatty infiltration is not evident in the conventional late enhancement for this subject.
Figure 14
Figure 14
Example of fatty infiltration of chronic MI which appears as a dark core MVO due to partial volume cancellation. Water and fat separated PSIR late enhancement images correctly classify the tissue into water and fat components.
Figure 15
Figure 15
A lipotamous mass has the appearance of a chronic MI in conventional late enhancement, but is correctly determined to be fat using fat water separated late enhancement.
Figure 16
Figure 16
Time course of single shot PSIR SSFP for patient with acute MI during early enhancement when gadolinium washes in and fills the dark core region of microvascular obstruction.

References

    1. Kim RJ, Fieno DS, Parrish TB, et al. Relationship of MRI delayed contrast enhancement to irreversible injury, infarct age, and contractile function. Circulation. 1999;100:1992–2002. - PubMed
    1. Fieno DS, Kim RJ, Chen EL, Lomasney JW, Klocke FJ, Judd RM. Contrast-enhanced magnetic resonance imaging of myocardium at risk: distinction between reversible and irreversible injury throughout infarct healing. J Am Coll Cardiol. 2000;36:1985–1991. - PubMed
    1. Hunold P, Schlosser T, Vogt FM, et al. Myocardial late enhancement in contrast-enhanced cardiac MRI: distinction between infarction scar and non-infarction-related disease. Am J Roentgenol. 2005 May;184(5):1420–6. - PubMed
    1. Bohl S, Wassmuth R, Abdel-Aty H, Rudolph A, Messroghli D, Dietz R, Schulz-Menger J. Delayed enhancement cardiac magnetic resonance imaging reveals typical patterns of myocardial injury in patients with various forms of non-ischemic heart disease. Int J Cardiovasc Imaging. 2008 Aug;24(6):597–607. - PubMed
    1. Vergara GR, Marrouche NF. Tailored management of atrial fibrillation using a LGE-MRI based model: from the clinic to the electrophysiology laboratory. J Cardiovasc Electrophysiol. 2011 Apr;22(4):481–7. - PubMed

Publication types

MeSH terms