. 2012 Nov;40(21):e169.
doi: 10.1093/nar/gks743. Epub 2012 Aug 16.

Functional impact bias reveals cancer drivers

Affiliations

Functional impact bias reveals cancer drivers

Abel Gonzalez-Perez et al. Nucleic Acids Res. 2012 Nov.

Abstract

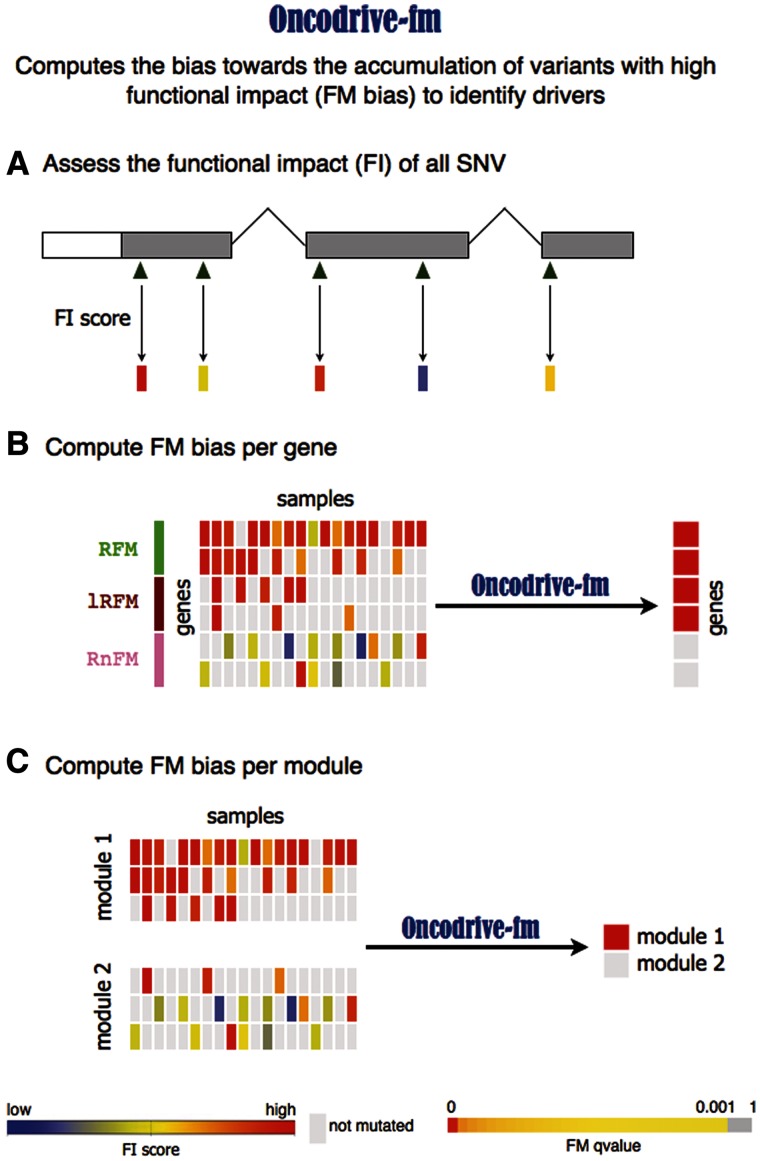
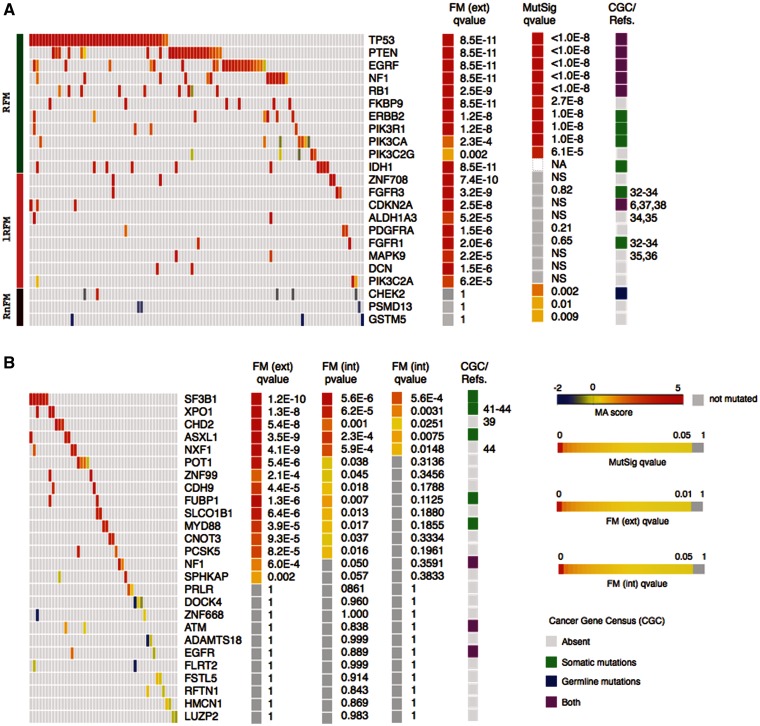
Identifying cancer driver genes and pathways among all somatic mutations detected in a cohort of tumors is a key challenge in cancer genomics. Traditionally, this is done by prioritizing genes according to the recurrence of alterations that they bear. However, this approach has some known limitations, such as the difficulty to correctly estimate the background mutation rate, and the fact that it cannot identify lowly recurrently mutated driver genes. Here we present a novel approach, Oncodrive-fm, to detect candidate cancer drivers which does not rely on recurrence. First, we hypothesized that any bias toward the accumulation of variants with high functional impact observed in a gene or group of genes may be an indication of positive selection and can thus be used to detect candidate driver genes or gene modules. Next, we developed a method to measure this bias (FM bias) and applied it to three datasets of tumor somatic variants. As a proof of concept of our hypothesis we show that most of the highly recurrent and well-known cancer genes exhibit a clear FM bias. Moreover, this novel approach avoids some known limitations of recurrence-based approaches, and can successfully identify lowly recurrent candidate cancer drivers.


Figures

Figure 1.
Figure 1.
Schematic representation of the Oncodrive-fm approach. Oncodrive-fm computes the bias toward the accumulation of variants with high FI to identify drivers. (A) The first step consists in calculating a FI score of variants identified in a cohort of patients. (B) Next, Oncodrive-fm assesses if there is a bias toward the accumulation of variants with high FI (FM bias) for each gene, giving as a result a P-value per gene that indicates how biased it is with respect to a null distribution. Note that Oncodrive-fm does not assess how likely it is that a gene has a particular number of mutations, but instead given the number of mutations it has, how biased they are to high FI. RFM, Recurrent and FM biased; lRFM, Lowly Recurrent and FM biased; RnFM, Recurrent but not-FM biased. (C) Oncodrive-fm can also be used to assess the FM bias of gene modules (e.g. Pathways).
Figure 2.
Figure 2.
Examples of high and low ranking FM-biased genes and gene modules identified by Oncodrive-fm in the gbm and cll datasets. (Main heatmaps in (A) and (B) show samples in columns and genes in rows and the color illustrates the MA scores of somatic mutations.) (A) Gbm genes analyzed by Oncodrive FM can be found RFM (green bar at the extreme left of the panel), lRFM (pink) or RnFM (dark red). (B) Top 15 and bottom 11 ranking genes (in terms of FM corrected external P-value) of the cll dataset. FM ext. qv, corrected P-values of the FM bias analysis using the external null distribution. MutSig qv, corrected P-values of the mutation recurrence analysis (implemented by MutSig). FM int. pv, P-values of the FM bias analysis using the internal null distribution. FM int. qv, corrected P-values of the FM bias analysis using the internal null distribution. CGC/Refs, Annotations from the Cancer Gene Census or general literature (numbers correspond to references in the text) linking genes to tumor development. All heatmaps were built using Gitools (47) and include only genes with at least two mutated samples. NA, not included in the MutSig analysis; NS, not significant.
Figure 3.
Figure 3.
Examples of significantly FM-biased pathways in gbm and cll. (A) and (B) Genes with somatic mutations in gbm tumors in the MAPK (KEGG) and mTOR (BIOCARTA) pathways, respectively. (C) Genes with variants in cll tumors in the mRNA SPLICING (REACTOME) pathway. FM ext. qv, corrected P-values of the FM bias analysis using the external null distribution. FM int. qv, corrected P-values of the FM bias analysis using the internal null distribution. All heatmaps include only samples with variants.

References

    1. Hanahan D, Weinberg RA. Hallmarks of cancer: the next generation. Cell. 2011;144:646–674. - PubMed
    1. Futreal PA, Coin L, Marshall M, Down T, Hubbard T, Wooster R, Rahman N, Stratton MR. A census of human cancer genes. Nat. Rev. Cancer. 2004;4:177–183. - PMC - PubMed
    1. Wood LD, Parsons DW, Jones S, Lin J, Sjöblom T, Leary RJ, Shen D, Boca SM, Barber T, Ptak J, et al. The genomic landscapes of human breast and colorectal cancers. Science. 2007;318:1108–1113. - PubMed
    1. Agrawal N, Frederick MJ, Pickering CR, Bettegowda C, Chang K, Li RJ, Fakhry C, Xie T-X, Zhang J, Wang J, et al. Exome sequencing of head and neck squamous cell carcinoma reveals inactivating mutations in NOTCH1. Science. 2011;333:1154–1157. - PMC - PubMed
    1. ICGC. International network of cancer genome projects. Nature. 2010;464:993–998. - PMC - PubMed

Publication types