. 2012 Oct;40(19):9543-56.
doi: 10.1093/nar/gks766. Epub 2012 Aug 16.

Diverse control of metabolism and other cellular processes in Streptomyces coelicolor by the PhoP transcription factor: genome-wide identification of in vivo targets

Affiliations

Diverse control of metabolism and other cellular processes in Streptomyces coelicolor by the PhoP transcription factor: genome-wide identification of in vivo targets

Nicholas E E Allenby et al. Nucleic Acids Res. 2012 Oct.

Abstract

Streptomycetes sense and respond to the stress of phosphate starvation via the two-component PhoR-PhoP signal transduction system. To identify the in vivo targets of PhoP we have undertaken a chromatin-immunoprecipitation-on-microarray analysis of wild-type and phoP mutant cultures and, in parallel, have quantified their transcriptomes. Most (ca. 80%) of the previously in vitro characterized PhoP targets were identified in this study among several hundred other putative novel PhoP targets. In addition to activating genes for phosphate scavenging systems PhoP was shown to target two gene clusters for cell wall/extracellular polymer biosynthesis. Furthermore PhoP was found to repress an unprecedented range of pathways upon entering phosphate limitation including nitrogen assimilation, oxidative phosphorylation, nucleotide biosynthesis and glycogen catabolism. Moreover, PhoP was shown to target many key genes involved in antibiotic production and morphological differentiation, including afsS, atrA, bldA, bldC, bldD, bldK, bldM, cdaR, cdgA, cdgB and scbR-scbA. Intriguingly, in the PhoP-dependent cpk polyketide gene cluster, PhoP accumulates substantially at three specific sites within the giant polyketide synthase-encoding genes. This study suggests that, following phosphate limitation, Streptomyces coelicolor PhoP functions as a 'master' regulator, suppressing central metabolism, secondary metabolism and developmental pathways until sufficient phosphate is salvaged to support further growth and, ultimately, morphological development.


Figures
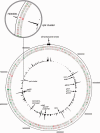
Figure 1.
Figure 1.
Summary of genomic distribution of PhoP–ChIP-enriched probes and differential expression of genes in wild-type and phoP mutant strain. Key to tracks from the outer circle in: track 1, all protein coding genes encoded in the 5′→ 3′ DNA strand; track 2, all protein coding genes encoded on the opposite DNA strand. Genes not significantly differentially expressed are coloured grey; genes that are significantly down-regulated in a phoP null mutant are coloured red and those significantly up-regulated in the phoP mutant are coloured green (see Supplementary Table S4 for gene list). Track 3 indicates probes (and enrichment ratio) that are significantly enriched by PhoP–ChIP. The zoomed-in area illustrates the highly enriched PhoP-binding regions in the cpk cluster, which represent by far the most enriched region of the genome; the ChIP-enriched probe data for the cpk probes were removed from track 3 of the main figure to avoid compression of the rest of the data. The location of ChIP peaks for selected target genes is indicated, as are the ends of the linear chromosome.
Figure 2.
Figure 2.
Sequence motifs. (A) The sequence logo derived from the ‘PhoP box’ sequences of the 26 previously identified promoters (listed in Supplementary Table S1). (B) The related 9 nt motif identified within the 500 nt sequences of the 417 PhoP–ChIP-enriched 5′ gene regions (listed in Supplementary Table S3); this is derived from 150 of the 333 unique promoter regions (several are divergently transcribed sequences).
Figure 3.
Figure 3.
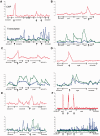
In vivo genomic distribution of PhoP and parallel measurement of adjacent gene expression, using the same microarray probe set, of selected novel PhoP targets in wild-type S. coelicolor and a phoP null mutant derivative. Two graphs are presented in each panel for each genomic region, (A–F). The y-axis of the top graph (in red) represents (i) the Cy-dye-balanced average wild-type PhoP–ChIP enrichment ratio relative to the same probe signal from the same chromatin subjected to a mock no-Ab IP divided by (ii) the equivalent PhoP enrichment ratio for that probe from chromatin of the phoP mutant [= wild-type/phoP mutant ChIP ratio; see Materials and Methods for more detail]; vertical arrows indicate the genomic regions deduced to be targeted by PhoP. The x-axis represents the genomic position of the probes and arrows represent genes; the genes at each end of the span are indicated along with specific genes of interest. Data are plotted with a custom R-script using the S. coelicolor genome annotation (Accession No. AL645882) for co-ordinates. For each panel the lower graph plots the derived transcript levels for each microarray probe (average [cDNA/gDNA] ratios) from the wild-type (in blue) and from the phoP mutant (in green). (A) PhoP-activated gene cluster SCO4873–SCO4881 implicated in cell wall polymer biosynthesis; (B) PhoP-repressed developmental regulator bldD and adjacent pyrimidine biosynthesis operon (note the large scale of expression axis); (C) A cluster of PhoP-repressed developmental genes and genes required for purine biosynthesis; (D) The cdgB gene, encoding a diguanylate kinase; (E) PhoP-repressed cdaR, encoding an activator of CDA biosynthesis; (F) Massive binding of PhoP internally to three sites across two PKS genes of the PhoP-dependent cpk cluster.
Figure 4.
Figure 4.
Distribution of PhoP-binding and differential expression of a selection of genes for diverse cellular processes in wild-type S. coelicolor and a phoP null mutant derivative. See legend to Figure 3 for detailed explanation of the respective pairs of plots. (A) clpC (protein integrity and degradation); (B) glgP (glycogen catabolism); (C) gyrB2 (DNA topology); (D) SCO5477–SCO5480 (ABC transporter).
Figure 5.
Figure 5.
Overview of the breadth of pathways and processes controlled by the PhoP transcription factor when S. coelicolor is encounters phosphate limitation in its environment.

References

    1. Sola-Landa A, Moura RS, Martin JF. The two-component PhoR-PhoP system controls both primary metabolism and secondary metabolite biosynthesis in Streptomyces lividans. Proc. Natl Acad. Sci. USA. 2003;100:6133–6138. - PMC - PubMed
    1. Ghorbel S, Smirnov A, Chouayekh H, Sperandio B, Esnault C, Kormanec J, Virolle MJ. Regulation of ppk expression and in vivo function of Ppk in Streptomyces lividans TK24. J. Bacteriol. 2006;188:6269–6276. - PMC - PubMed
    1. Sola-Landa A, Rodriguez-Garcia A, Apel AK, Martin JF. Target genes and structure of the direct repeats in the DNA-binding sequences of the response regulator PhoP in Streptomyces coelicolor. Nucleic Acids Res. 2008;36:1358–1368. - PMC - PubMed
    1. Apel AK, Sola-Landa A, Rodriguez-Garcia A, Martin JF. Phosphate control of phoA, phoC and phoD gene expression in Streptomyces coelicolor reveals significant differences in binding of PhoP to their promoter regions. Microbiology. 2007;153:3527–3537. - PubMed
    1. Santos-Beneit F, Rodriguez-Garcia A, Apel AK, Martin JF. Phosphate and carbon source regulation of two PhoP-dependent glycerophosphodiester phosphodiesterase genes of Streptomyces coelicolor. Microbiology. 2009;155:1800–1811. - PubMed

Publication types

MeSH terms