. 2012 Oct;40(19):9522-33.
doi: 10.1093/nar/gks767. Epub 2012 Aug 16.

The arginine methyltransferase PRMT6 regulates cell proliferation and senescence through transcriptional repression of tumor suppressor genes

Affiliations

The arginine methyltransferase PRMT6 regulates cell proliferation and senescence through transcriptional repression of tumor suppressor genes

Claudia Stein et al. Nucleic Acids Res. 2012 Oct.

Abstract

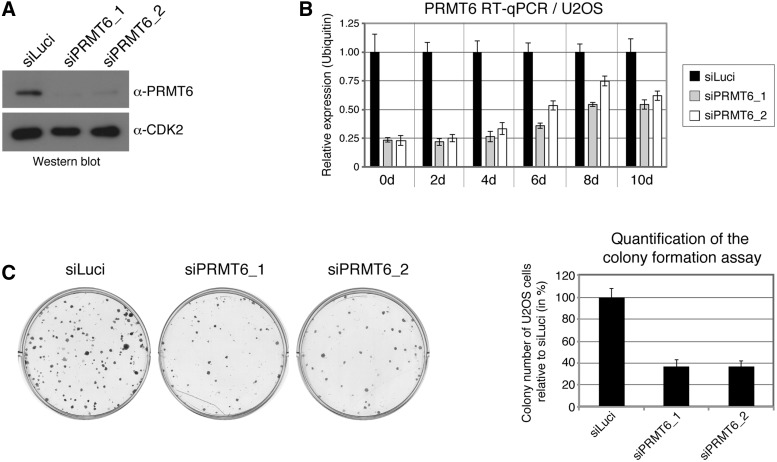
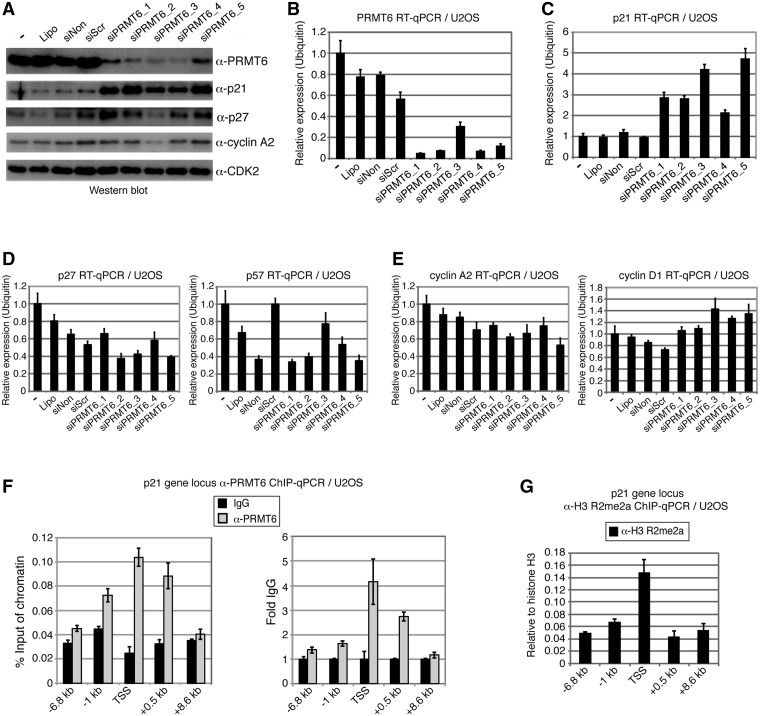
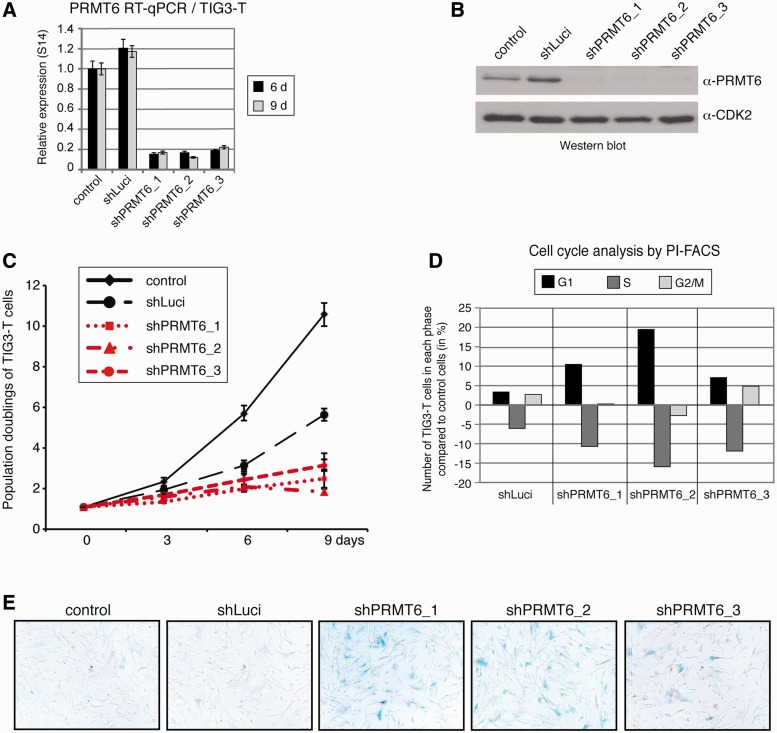
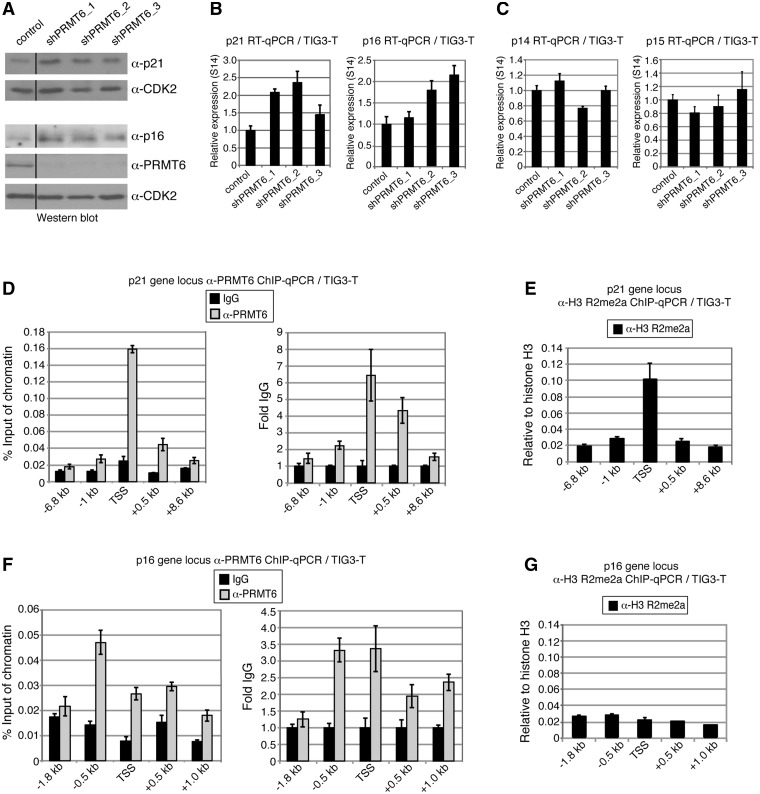
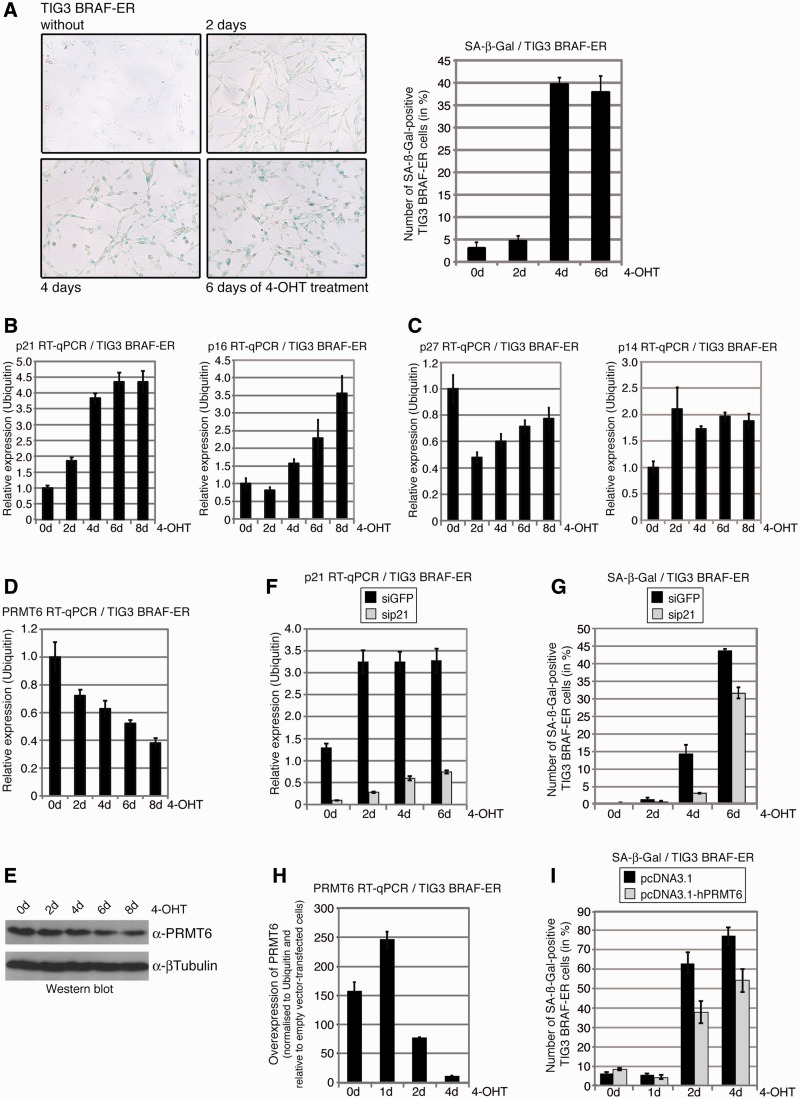
The protein arginine methyltransferase 6 (PRMT6) is a coregulator of gene expression and executes its repressing as well as activating function by asymmetric dimethylation of histone H3 at R2 (H3 R2me2a). Given that elevated expression levels of PRMT6 have been reported in various cancer types, we explore here its role in cell proliferation and senescence. We find that knockdown of PRMT6 results in proliferation defects of transformed as well as non-transformed cells, causes G1-phase arrest and induces senescence. This phenotype is accompanied by transcriptional upregulation of important cell cycle regulators, most prominently the cyclin-dependent kinase (CDK) inhibitor gene p21 (p21(CIP1/WAF1), CDKN1A) and p16 (p16(INK4A), CDKN2A). Chromatin immuno-precipitation analysis reveals that the p21 gene is a direct target of PRMT6 and the corresponding histone mark H3 R2me2a. Using a cell model of oncogene-induced senescence (OIS), in which p21 is an essential activator of the senescent phenotype, we show that PRMT6 expression declines upon induction of senescence and conversely p21 gene expression increases. Moreover, overexpression of PRMT6 leads to reduced levels of OIS. These findings indicate that the transcriptional repressor activity of PRMT6 facilitates cell proliferation and blocks senescence by regulation of tumor suppressor genes and that this might contribute to the oncogenic capacity of PRMT6.


Figures

Figure 1.
Figure 1.
Depletion of PRMT6 inhibits the colony formation in U2OS cells. (A) U2OS cells were transfected with siLuci or two alternative siRNAs directed against PRMT6 (siPRMT6_1 or siPRMT6_2) and harvested 72 h post transfection. Total protein (30 µg) of each sample was analyzed by western blot with the indicated antibodies. (B and C) U2OS cells were transfected with siRNAs as in (A). Forty-eight hours post transfection cells were replated for (B) preparation of total RNA and in triplicates for (C) colony formation assay. RNA was prepared at the indicated time points (0, 2, 4, 6, 8 and 10 days) and analyzed by RT–qPCR for the transcript levels of PRMT6 normalized to Ubiquitin (siLuci in black bars, siPRMT6_1 in gray bars, siPRMT6_2 in white bars). The colony formation assay was evaluated after 10 days. Representative dishes of crystal violet-stained colonies were photographed (left panel). The number of colonies was counted (right panel) and the quantification is presented as colony number in percentage of the siPRMT6 conditions relative to siLuci condition (the latter equated 100%). The result shown is the average of the triplicate countings (±SD).
Figure 2.
Figure 2.
PRMT6 regulates p21 gene expression in U2OS cells and is recruited to the p21 gene locus accompanied by enhanced H3 R2me2a level. (A) U2OS cells were transfected with siNon-targeting (siNon), siScramble (siScr) or five alternative siRNAs against PRMT6 (siPRMT6_1, _2, _3, _4, _5). Additional controls were untransfected cells (−) and Lipofectamine RNAiMAX (Lipo)-treated cells. Seventy-two hours post transfection cells were harvested and 30 µg total protein of each sample were analyzed by western blot with the indicated antibodies. (B–E) U2OS cells were treated with siRNAs or control conditions as in (A) for 72 h. Subsequently, cells were harvested and total RNA was prepared and analyzed by RT–qPCR for transcript levels of (B) PRMT6, (C) p21, (D) p27 and p57, (E) cyclin A2 and D1, respectively, normalized to Ubiquitin. (F and G) U2OS cells were harvested after 72 h and subjected to ChIP analysis using antibodies against (F) PRMT6 (gray bars) and corresponding control antibody (black bars, IgG rabbit) or (G) H3 R2me2a and corresponding control antibody (H3). Immunoprecipitated DNA was analyzed in triplicates by qPCR with primers spanning the indicated regions of the p21 gene locus. In (F), mean values were expressed as percent input of chromatin or as fold IgG, which was equated 1. In (G), mean values were expressed as relative enrichment compared to histone H3.
Figure 3.
Figure 3.
Depletion of PRMT6 results in a reduced cell proliferation rate, an accumulation of cells in G1-phase and enhanced senescence in TIG3-T cells. (A and B) TIG3-T cells were infected with retroviral vectors coding for shLuci or three alternative shRNA against PRMT6 (shPRMT6_1, _2, _3). Infections with empty vector served as an additional control. Forty-eight hours post infection cells were selected with puromycin (1 µg/ml) for 72 h. After 6 and 9 days, respectively, of shRNA-mediated depletion (Day 0 corresponds to 3 days after start of selection), cells were harvested and analyzed for (A) RNA and (B) protein. Total RNA from cells with 6 (black bars) or 9 days (gray bars) of shRNA expression was prepared and analyzed by RT–qPCR for PRMT6 transcript levels normalized to S14. Total protein (20 µg) of each sample (9 days only) were analyzed by western blot with the indicated antibodies. (C–E) TIG3-T cells were infected with shRNA constructs and selected with puromycin as in (A and B). (C) Representative growth curves of TIG3-T cells are shown in which cells were seeded for 3T3 assay up to 9 days. Day 0 is the time point of plating for the 3T3 assay and corresponds to 3 days after start of selection. (D) After 7 days of shRNA-mediated depletion (Day 0 corresponds to 3 days after start of selection), cells were fixed, stained with PI and analyzed by flow cytometry for G1 (black bars), S (dark gray bar) and G2/M-phase (bright gray bars). Data show changes in each phase of cell cycle (in percent) relative to control cells (empty vector) and are representative results of several independent experiments. (E) After 7 days of shRNA-mediated depletion (Day 0 corresponds to 3 days after start of selection), cells were stained for SA-β-Gal activity. SA-β-Gal staining was photographed using a bright field microscope. Data show a representative result of several independent experiments.
Figure 4.
Figure 4.
The cell cycle regulators p21 and p16 are direct transcriptional targets of PRMT6 in TIG3-T cells. (A) TIG3-T cells were infected with three alternative shRNA vectors against PRMT6 (shPRMT6_1, _2, _3). The empty vector served as control. Forty-eight hours post infection cells were selected with puromycin (1 µg/ml) for 72 h. After 6 days of shRNA-mediated depletion (Day 0 corresponds to 3 days after start of selection), cells were harvested and 20 µg total protein of each sample were analyzed by western blot with the indicated antibodies. The black line indicates that the scan was cut at this point, but all stainings shown are from the same blot and exposure time. (B and C) TIG3-T cells were treated as in (A). Total RNA was prepared and analyzed by RT–qPCR for (B) p21 and p16 and (C) p14 and p15 transcript levels normalized to S14. (D–G) TIG3-T cells were harvested after 72 h and subjected to ChIP analysis using antibodies against (D and F) PRMT6 (gray bars) and corresponding control antibody (black bars, IgG rabbit) or (E and G) H3 R2me2a and corresponding control antibody (H3). Immunoprecipitated DNA was analyzed in triplicates by qPCR with primers spanning the indicated regions of the (D and E) p21 and (F and G) p16 gene locus. In (D and F), mean values were expressed as percent input of chromatin or as fold IgG, which was equated 1. In (E and G), mean values were expressed as relative enrichment compared to histone H3.
Figure 5.
Figure 5.
Effects of OIS on PRMT6 and p21 expression in TIG3 BRAF-ER cells and the relevance of PRMT6 and p21 in this model of OIS. (A) TIG3 BRAF-ER cells were treated with 4-OHT (200 nM) and stained for SA-β-Gal activity at the indicated time points. SA-β-Gal staining was photographed using a bright field microscope (left panel). The number of SA-β-Gal-positive TIG3 BRAF-ER cells was quantified (right panel). The presented result in percentage is the average from triplicate countings (each with 300 cells) ± SD. Data show a representative result of several independent experiments. (B–E) TIG3 BRAF-ER cells were treated with 4-OHT as in (A). (B–D) Total RNA was prepared and analyzed by RT–qPCR for the transcript levels of (B) p21 and p16 and (C) p27 and p14 and (D) PRMT6 at the indicated time points normalized to Ubiquitin. (E) Cells were harvested at the indicated time points and 20 µg total protein of each sample were analyzed by western blot with the indicated antibodies. (F and G) TIG3 BRAF-ER cells were transfected with siGFP or siRNAs (pool of three sequences) directed against the p21 transcript. Forty-eight hours post transfection cells were treated with 4-OHT (200 nM) for the indicated time course (Day 0 corresponds to 2 days after start of siRNA-mediated depletion). Total RNA of the siGFP (black bars) and sip21 conditions (gray bars) was prepared and analyzed by RT–qPCR for the transcript levels of (F) p21 normalized to Ubiquitin. SA-β-Gal-positive cells (G) were counted at the indicated time points either for siGFP- (black bars) or sip21-depleted cells (gray bars). The presented result in percentage is the average from triplicate countings (each with 300 cells) ± SD. Data show a representative result of several independent experiments. (H and I) TIG3 BRAF-ER cells were transfected with empty vector (pcDNA3.1) or pcDNA3.1-hPRMT6 plasmid. Forty-eight hours post transfection cells were treated with 4-OHT (200 nM) for the indicated time points (Day 0 corresponds to 2 days after start of transfection). Total RNA was prepared and analyzed by RT–qPCR for the transcript levels of (H) PRMT6 normalized to Ubiquitin. Transcript levels of PRMT6 upon overexpression are shown relative to the PRMT6 levels of empty vector-transfected conditions, which were set to 1 for each time point (0, 1, 2 and 4 days). SA-β-Gal-positive cells (I) were counted at the indicated time points either for empty vector (pcDNA3.1)-transfected (black bars) or pcDNA3.1-hPRMT6-transfected cells (gray bars). The presented result in percentage is the average from triplicate countings (each with 300 cells) ± SD. Data show a representative result of several independent experiments.

Similar articles

Cited by

References

    1. Bedford MT, Clarke SG. Protein arginine methylation in mammals: who, what, and why. Mol. Cell. 2009;33:1–13. - PMC - PubMed
    1. Di Lorenzo A, Bedford MT. Histone arginine methylation. FEBS Lett. 2011;585:2024–2031. - PMC - PubMed
    1. Lee YH, Stallcup MR. Minireview: protein arginine methylation of nonhistone proteins in transcriptional regulation. Mol. Endocrinol. 2009;23:425–433. - PMC - PubMed
    1. Frankel A, Yadav N, Lee J, Branscombe TL, Clarke S, Bedford MT. The novel human protein arginine N-methyltransferase PRMT6 is a nuclear enzyme displaying unique substrate specificity. J. Biol. Chem. 2002;277:3537–3543. - PubMed
    1. Lakowski TM, Frankel A. A kinetic study of human protein arginine N-methyltransferase 6 reveals a distributive mechanism. J. Biol. Chem. 2008;283:10015–10025. - PubMed

Publication types

MeSH terms

Substances