

doi: 10.1093/nar/gks757.
Epub 2012 Aug 16.
PanOCT: automated clustering of orthologs using conserved gene neighborhood for pan-genomic analysis of bacterial strains and closely related species
Affiliations
- PMID: 22904089
- PMCID: PMC3526259
- DOI: 10.1093/nar/gks757
Item in Clipboard
PanOCT: automated clustering of orthologs using conserved gene neighborhood for pan-genomic analysis of bacterial strains and closely related species
Nucleic Acids Res.
2012 Dec.
Abstract
Pan-genome ortholog clustering tool (PanOCT) is a tool for pan-genomic analysis of closely related prokaryotic species or strains. PanOCT uses conserved gene neighborhood information to separate recently diverged paralogs into orthologous clusters where homology-only clustering methods cannot. The results from PanOCT and three commonly used graph-based ortholog-finding programs were compared using a set of four publicly available strains of the same bacterial species. All four methods agreed on ∼70% of the clusters and ∼86% of the proteins. The clusters that did not agree were inspected for evidence of correctness resulting in 85 high-confidence manually curated clusters that were used to compare all four methods.
Figures
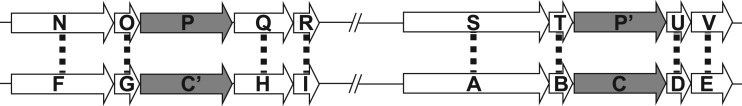
An example of how CGN can be used to cluster paralogous genes into orthologous pairs. Open arrows indicate proteins, with dotted lines illustrating best BLAST matches. Gray arrows indicate paralogous proteins with multiple high-identity BLAST matches. The genes on top are from one genome and those on the bottom from a second genome. The slashes indicated that there are genes in between not drawn.
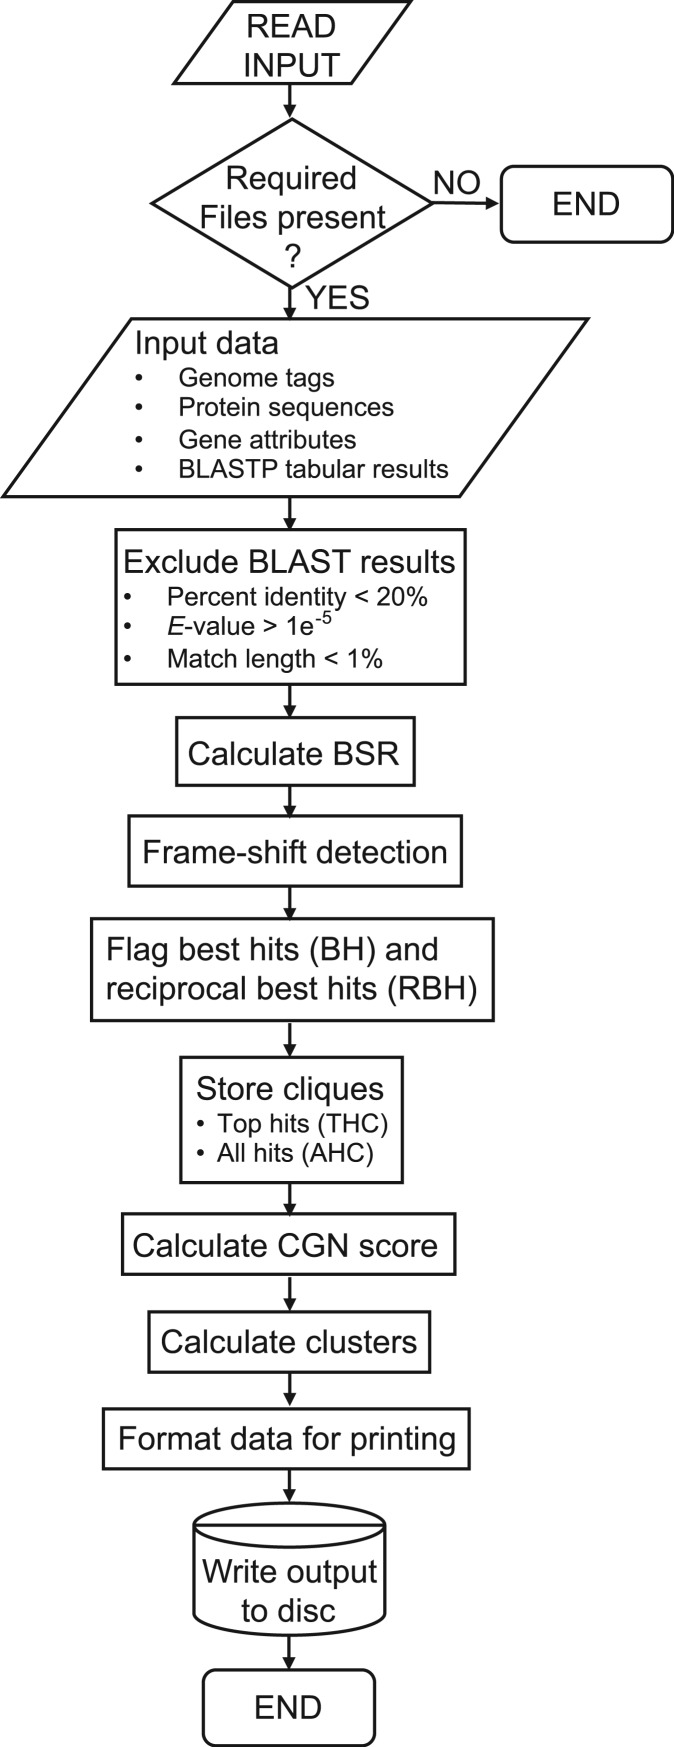
Flow chart of PanOCT.pl logic. Standard symbols for constructing flow charts were used.
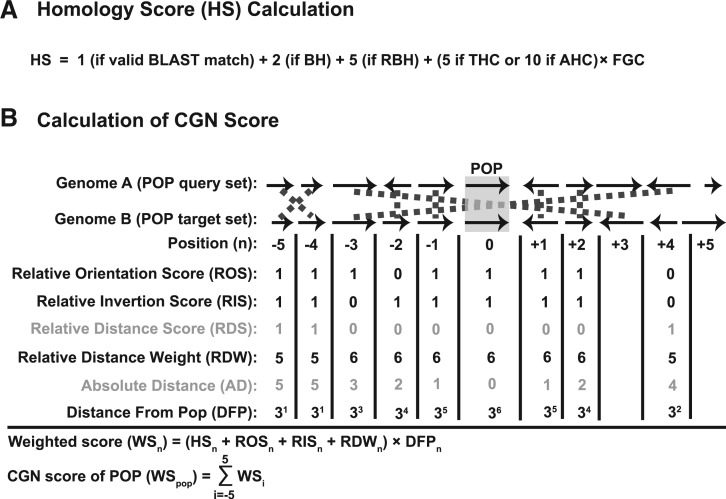
Calculation of the HS (A) and an example of how the CGN is computed (B).
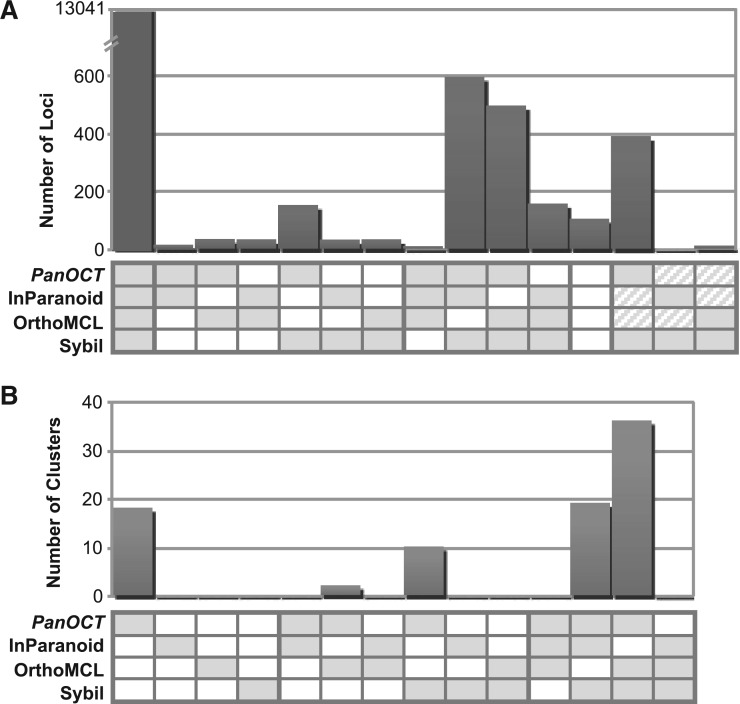
Agreement/disagreement between how proteins are clustered by the four methods for the entire set of clusters (A) and for the 85 manually curated clusters (B). The number of proteins (A) or clusters (B) that are in agreement for each possible subset of the four methods is graphed. Each subset pattern is indicated with shaded boxes for agreement and open boxes for disagreement. For example, when there are two shaded boxes and two open boxes the two shaded methods agree and the two open methods disagree with all three other methods; diagonal lines in a box indicate that while the two methods with diagonal lines disagree with the two shaded methods they agree with each other.
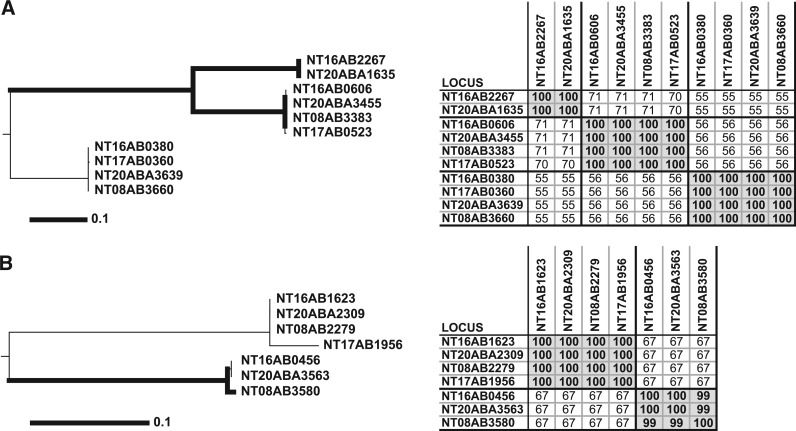
Separation of divergent paralogs into orthologous clusters. The left panels denote consensus Neighbor-joining trees from 100 bootstrap replicates as previously described (26). The thick lines infer the strength of bootstrap values >74. The scale bar represents the number of amino acid substitutions. The panels on the right show tables of pairwise BLAST protein percent identities. OrthoMCL (A) and InParanoid (B) grouped every protein depicted into two large clusters (one in A and another in B), while the other three methods produced clusters identical with the phylogenetic trees (three in A and two in B). Protein percent identity was sufficient to group these proteins into unambiguous clusters (tables on right).
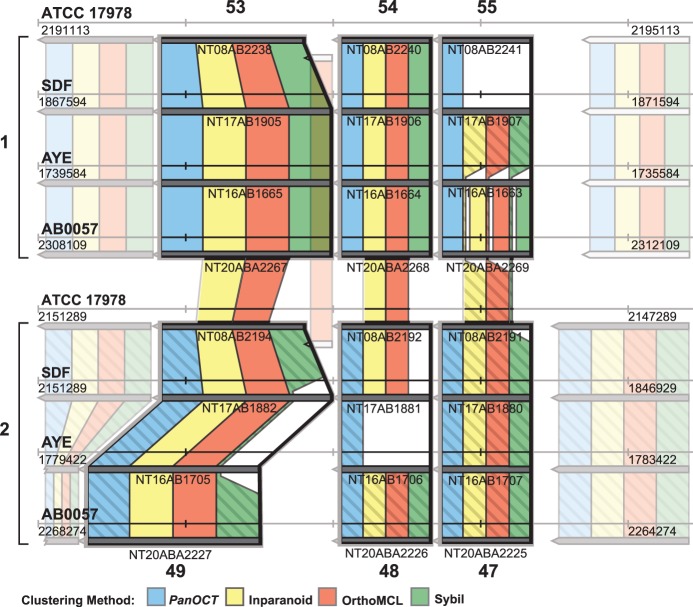
Separation of paralogs into orthologous clusters using CGN. Cluster results of each of the four methods compared with six reference clusters. Reference clusters are outlined in bold (reference clusters 53, 54, 55, 49, 48 and 47 from Supplementary Table S1 ). Note that reference clusters 53, 54 and 55 are located in a chromosomal region different from reference clusters 49, 48 and 47. These regions are labeled 1 and 2, respectively, and method cluster results are colored either solid or hashed to help differentiate.
References
-
- Tettelin H, Masignani V, Cieslewicz MJ, Donati C, Medini D, Ward NL, Angiuoli SV, Crabtree J, Jones AL, Durkin AS, et al. Genome analysis of multiple pathogenic isolates of Streptococcus agalactiae: implications for the microbial “pan-genome”. Proc. Natl Acad. Sci. USA. 2005;102:13950–13955. - PMC - PubMed
-
- Tettelin H, Riley D, Cattuto C, Medini D. Comparative genomics: the bacterial pan-genome. Curr. Opin. Microbiol. 2008;11:472–477. - PubMed
-
- Fitch WM. Distinguishing homologous from analogous proteins. Syst. Zool. 1970;19:99–113. - PubMed
-
- Kuzniar A, van Ham RC, Pongor S, Leunissen JA. The quest for orthologs: finding the corresponding gene across genomes. Trends Genet. 2008;24:539–551. - PubMed
