. 2012 Sep 15;189(6):2784-92.
doi: 10.4049/jimmunol.1200310. Epub 2012 Aug 17.

Inhibition of JAKs in macrophages increases lipopolysaccharide-induced cytokine production by blocking IL-10-mediated feedback

Affiliations

Inhibition of JAKs in macrophages increases lipopolysaccharide-induced cytokine production by blocking IL-10-mediated feedback

Michael J Pattison et al. J Immunol. .

Abstract

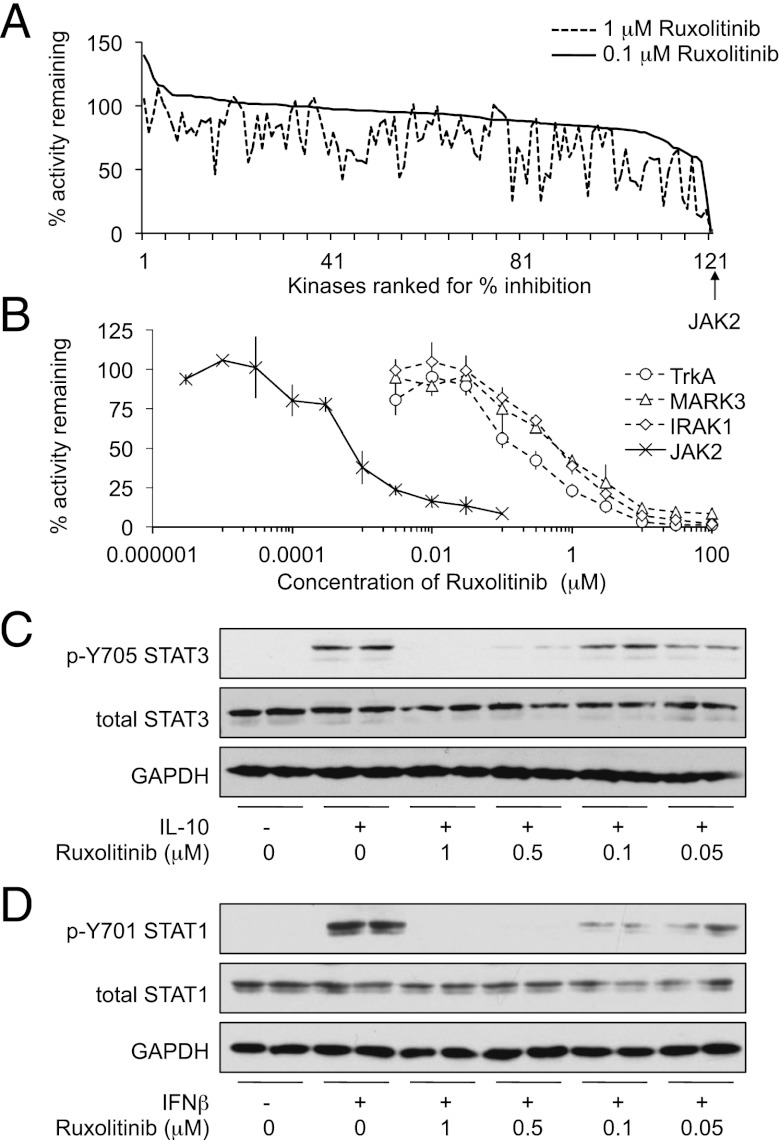
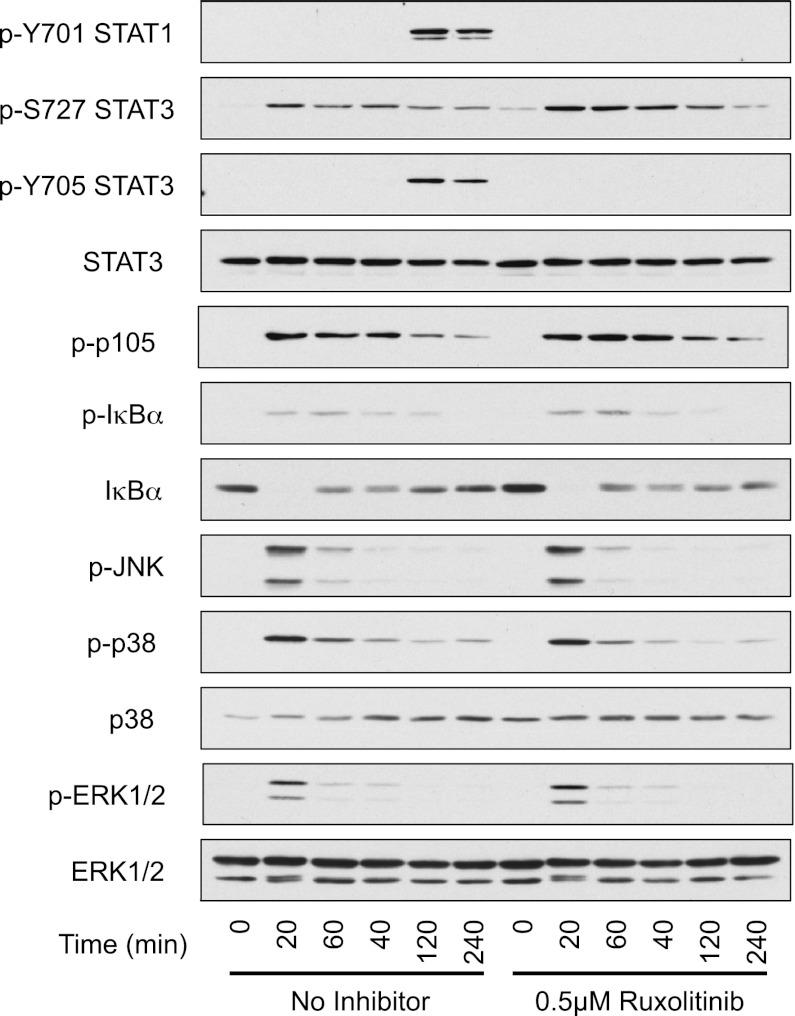
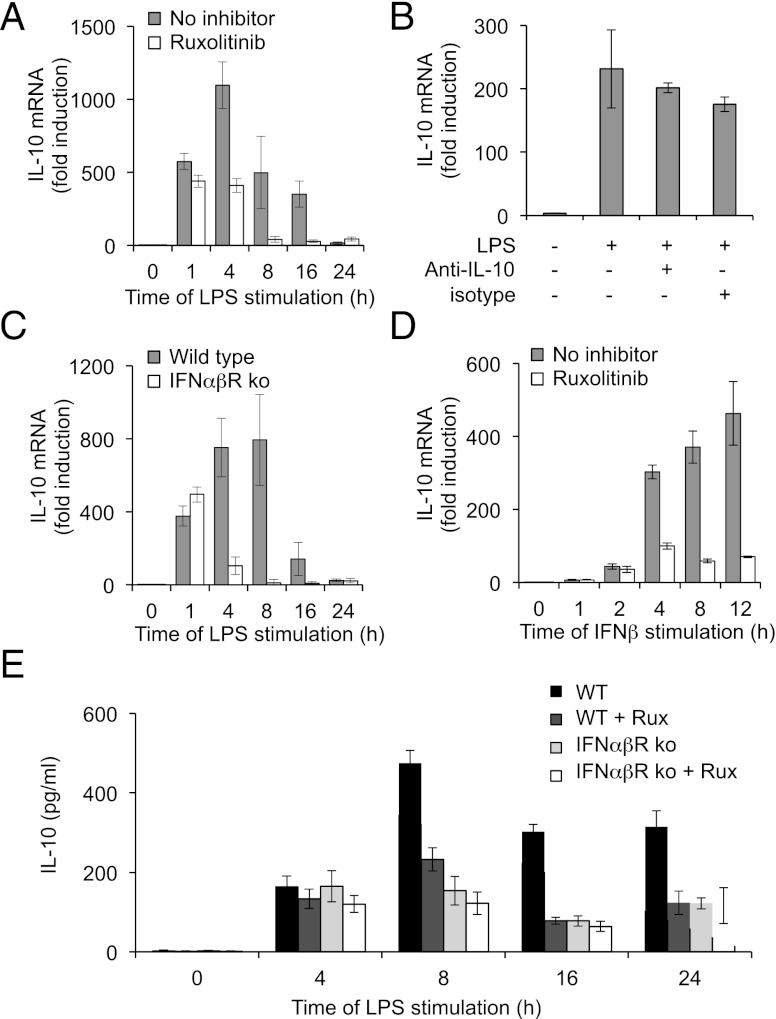
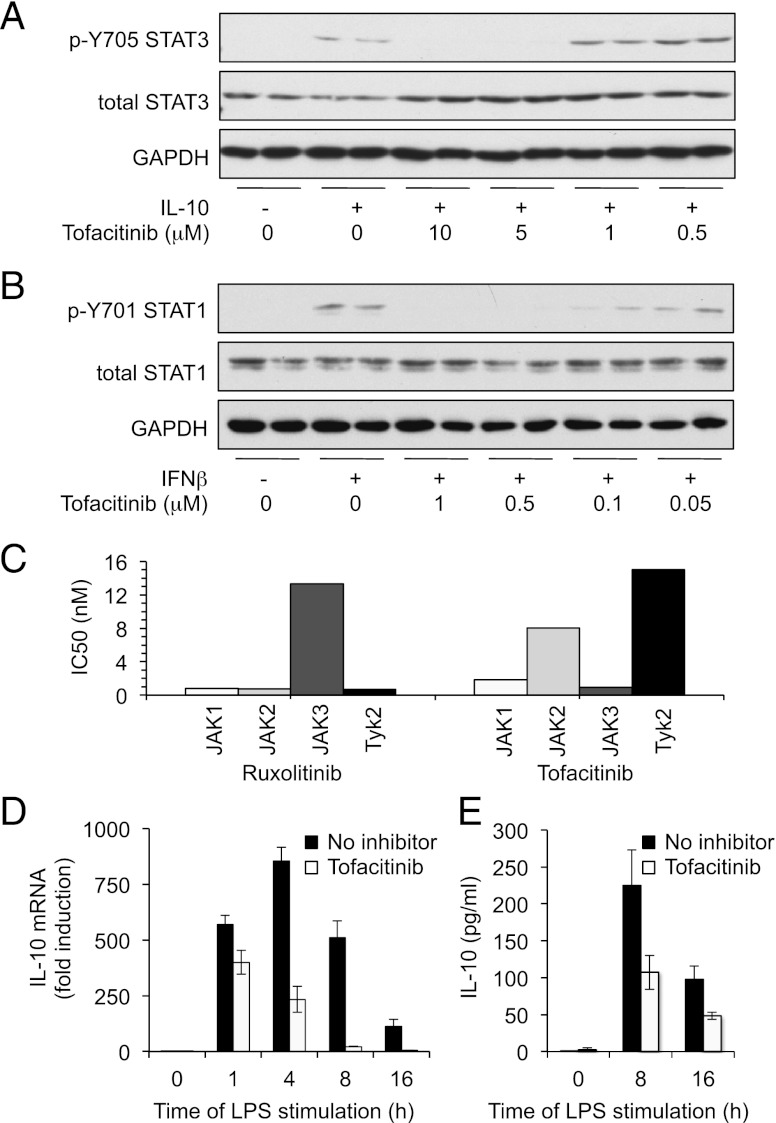
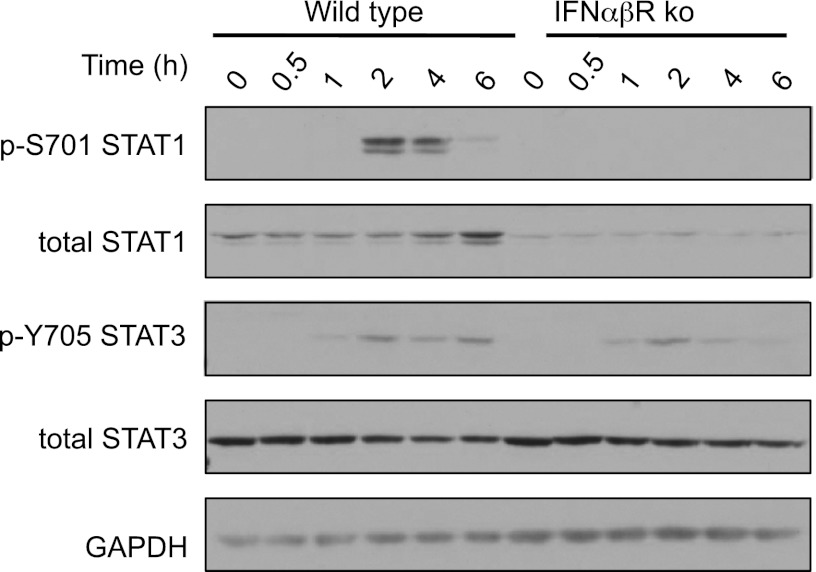
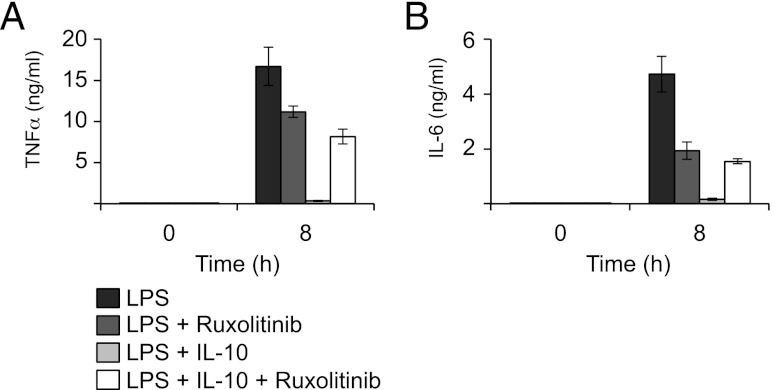
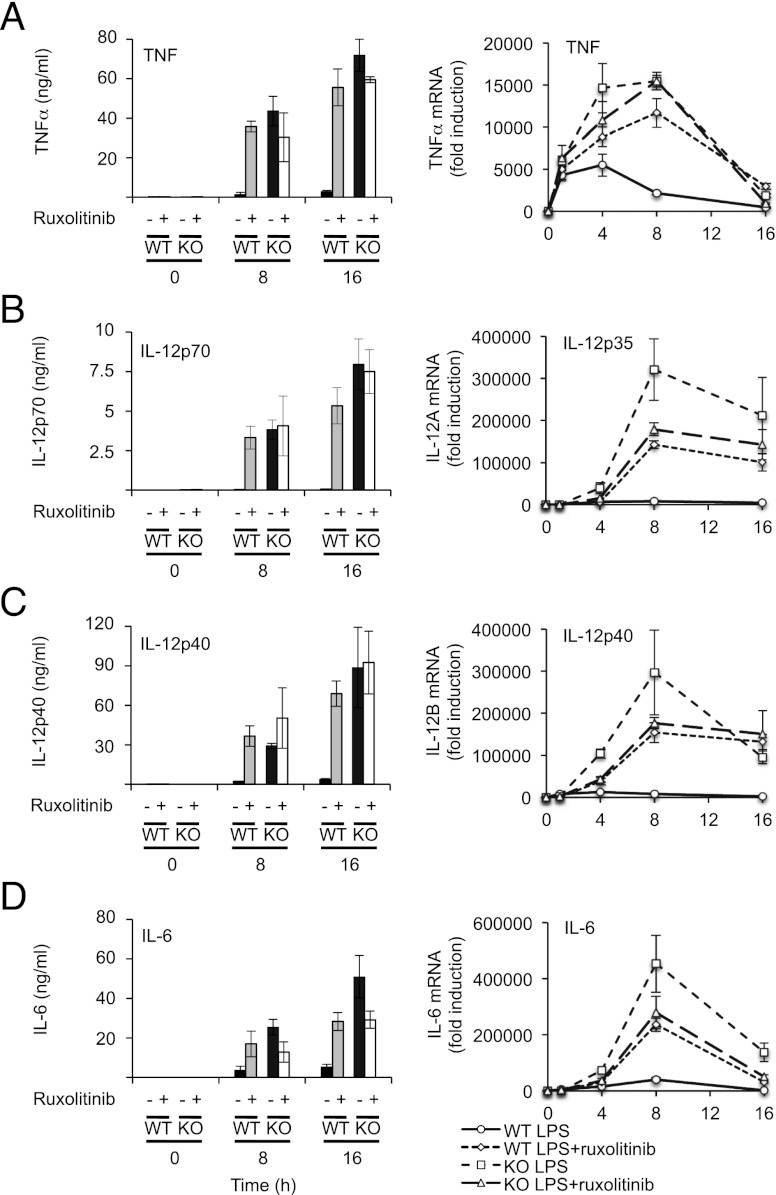
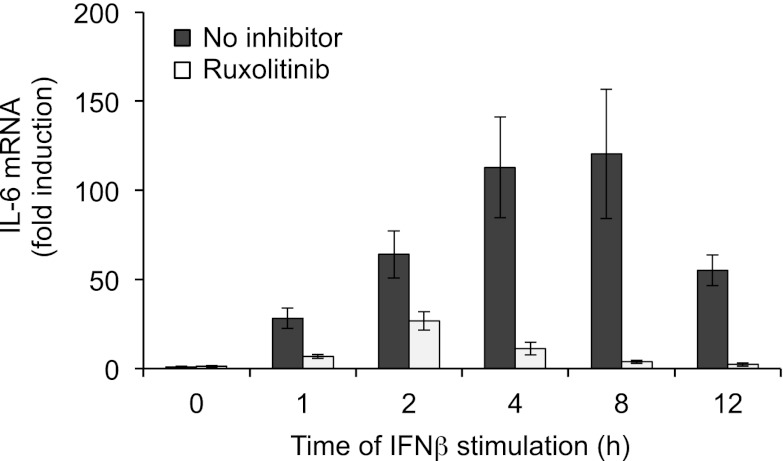
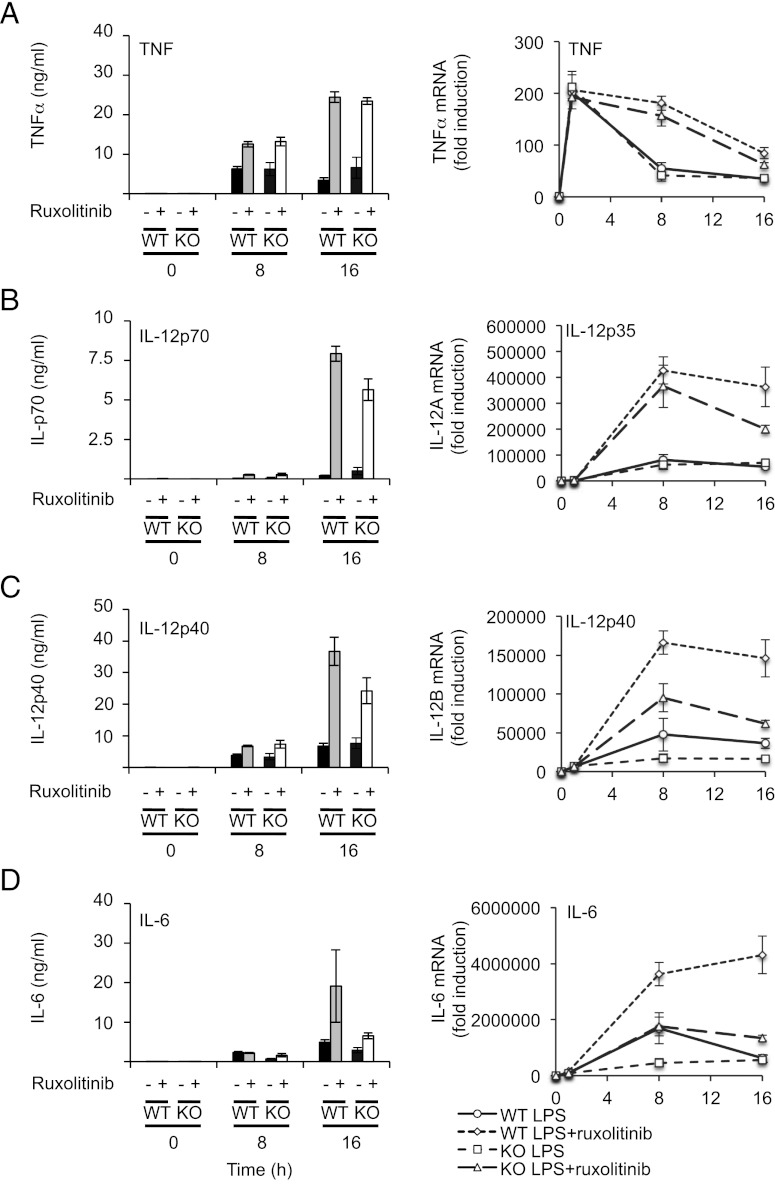
Macrophages are an important source of cytokines following infection. Stimulation of macrophages with TLR agonists results in the secretion of TNF-α, IL-6, and IL-12, and the production of these cytokines is controlled by multiple feedback pathways. Macrophages also produce IL-10, which acts to inhibit proinflammatory cytokine production by macrophages via a JAK/STAT3-dependent pathway. We show in this paper that, Ruxolitinib, a recently described selective inhibitor of JAKs, increases TNF, IL-6, and IL-12 secretion in mouse bone marrow-derived macrophages stimulated with LPS. This effect is largely due to its ability to block IL-10-mediated feedback inhibition on cytokine transcription in macrophages. Similar results were also obtained with a second structurally unrelated Jak inhibitor, Tofacitinib. In addition, LPS induced the production of IFN-β, which was then able to activate JAKs in macrophages, resulting in the stimulation of STAT1 phosphorylation. The initial induction of IL-10 was independent of JAK signaling; however, inhibition of JAKs did reduce IL-10 secretion at later time points. This reflected a requirement for the IFN-β feedback loop to sustain IL-10 transcription following LPS stimulation. In addition to IL-10, IFN-β also helped sustain IL-6 and IL-12 transcription. Overall, these results suggest that inhibition of JAKs may increase the inflammatory potential of macrophages stimulated with TLR4 agonists.


Figures

FIGURE 1.
FIGURE 1.
Ruxolitinib selectively inhibits JAK and blocks STAT phosphorylation in BMDMs. (A) Ruxolitinib was screened at 0.1 or 1 μM against a panel of 121 kinases in vitro as described in Materials and Methods. For the graph in (A), kinases were then ranked in order of the percentage activity remaining at 0.1 μM Ruxolitinib. (B) JAK2, IRAK1, MAPK3, and TrkA kinases assays were carried out in the indicated concentrations of Ruxolitinib as described in Materials and Methods. Percentage activity was calculated relative to the activity in the absence of Ruxolitinib. Data are reported in Supplemental Table I. Error bars represent the SD of four replicates. (C) BMDMs were isolated from wild-type mice and incubated in the indicated concentrations of Ruxolitinib for 1 h before stimulation with 100 ng/ml IL-10 for 30 min. Levels of GAPDH as well as total and phospho-Tyr705 STAT3 were determined by immunoblotting. (D) As in (C), but cells were stimulated with 500 U/ml IFN-β instead of IL-10.
FIGURE 2.
FIGURE 2.
Ruxolitinib inhibits LPS-mediated STAT3 phosphorylation but not MAPK or NF-κB activation. BMDMs were prepared from wild-type mice and where indicated were treated with 0.5 μM Ruxolitinib for 1 h. Cells were then stimulated for the indicated times with 100 ng/ml LPS. Levels of STAT3 (total, p-Y705, and p-S727), STAT1 (p-Y701), ERK1/2 (total and phospho), phospho-JNK, p38 (total and phospho), phospho-p105, and IκB (total and phospho) were determined by immunoblotting.
FIGURE 3.
FIGURE 3.
Ruxolitinib inhibits sustained IL-10 production in response to LPS. (A) BMDMs were isolated from wild-type mice and where indicated were treated with 0.5 μM Ruxolitinib. Cells were then stimulated with 100 ng/ml LPS for the indicated times. Total RNA was isolated, and IL-10 mRNA levels were determined by Q-PCR. (B) BMDMs were treated with either 100 ng/ml LPS alone or in the presence of 10 μg/ml of either an IL-10 neutralizing Ab (anti–IL-10) or isotype control. After 16 h, cells were lysed, and IL-10 mRNA levels were measured by Q-PCR. (C) BMDMs were isolated from wild-type mice or IFNαβR knockout mice. Cells were stimulated with 100 ng/ml LPS for the indicated times, and total RNA isolated and IL-10 mRNA levels determined by Q-PCR. (D) BMDMs were isolated from wild-type mice and where indicated were treated with 0.5 μM Ruxolitinib. Cells were then stimulated with 500 U/ml IFN-β for the indicated times, and IL-10 mRNA levels were determined by Q-PCR. BMDMs were isolated from wild-type and IFNαβR knockout mice and were treated with 0.5 μM Ruxolitinib. Cells were then stimulated with 100 ng/ml LPS for the indicated times, and levels of IL-10 secreted into the media were determined by multiplex. In all panels, error bars represent the SD from independent cultures from four mice per genotype.
FIGURE 4.
FIGURE 4.
Tofacitinib inhibits sustained IL-10 production in response to LPS. BMDMs were isolated from wild-type mice and incubated in the indicated concentrations of Tofacitinib for 1 h before stimulation with 100 ng/ml IL-10 (A) or 500 U/ml IFN-β (B) for 30 min. Levels of GAPDH, STAT3 (total and p-Y705), and STAT1 (total and p-Y701) were determined by immunoblotting. (C) In vitro IC50 values for Tofacitinib and Ruxolitinib were determined as described in the supplemental information. (D) BMDMs were pretreated with 5 μM Tofacitinib for 1 h where indicated. Cells were then stimulated with 100 ng/ml LPS for the indicated times, and IL-10 mRNA levels were measured by Q-PCR. (E) As in (D), except the levels of IL-10 secreted into the culture media was measured. For both (D) and (E), error bars represent the SD of independent cultures from four mice.
FIGURE 5.
FIGURE 5.
Induction of signaling by IFN-β is required for LPS-induced Tyr phosphorylation of STAT1 but not STAT3. BMDMs were isolated from wild-type or IFNαβR knockout mice and stimulated with 100 ng/ml LPS for the indicated times. Levels of phospho-STAT1, STAT3 and total STAT1, STAT3, and GAPDH were determined by immunoblotting.
FIGURE 6.
FIGURE 6.
Ruxolitinib prevents the IL-10–mediated repression of TLR4-induced cytokine production. BMDMs were isolated from IL-10 knockout mice and where indicated preincubated for 1 h in 0.5 μM Ruxolitinib. Cells were then stimulated with either 100 ng/ml LPS or a combination of LPS and 100 ng/ml IL-10 for 6 h. Secreted levels of TNF-α (A) and IL-6 (B) were determined using a Luminex-based multiplex assay. Error bars represent the SD of independent BMDM cultures from four mice.
FIGURE 7.
FIGURE 7.
Ruxolitinib treatment mimics the effect of IL-10 knockout on LPS-mediated cytokine production. Wild-type or IL-10 knockout BMDMs were pretreated with 0.5 μM Ruxolitinib where indicated and then stimulated with 100 ng/ml LPS for the indicated times. Levels of TNF-α (A), IL-12p70 (B), IL-12p40 (C), and IL-6 (D) secreted into the media were determined by Luminex-based multiplex assay (left panels). Levels of TNF-α (A), IL-12p35 (B), IL-12p40 (C), and IL-6 (D) mRNA were determined by Q-PCR (right panels). Error bars represent the SD of independent BMDM cultures from four mice per genotype.
FIGURE 8.
FIGURE 8.
IFN-stimulated transcription of IL-6. Wild-type BMDMs were incubated for 1 h in 0.5 μM Ruxolitinib where indicated. Cells were then stimulated with 500 U/ml IFN-β for the indicated times and IL-6 mRNA levels determined by Q-PCR. Error bars represent the SD of independent BMDM cultures from four mice.
FIGURE 9.
FIGURE 9.
IFNαβR knockout affects LPS-stimulated IL-6 but not TNF-α or IL-12 production. Wild-type or IL-10 knockout BMDMs were pretreated with 0.5 μM Ruxolitinib where indicated and then stimulated with 100 ng/ml LPS for the indicated times. Levels of TNF-α (A), IL-12p70 (B), IL-12p40 (C), and IL-6 (D) secreted into the media were determined by Luminex-based multiplex assay (left panels). Levels of TNF-α (A), IL-12p35 (B), IL-12p40 (C), and IL-6 (D) mRNA were determined by Q-PCR (right panels). Error bars represent the SD of independent BMDM cultures from four mice per genotype.

References

    1. Schindler C., Levy D. E., Decker T. 2007. JAK-STAT signaling: from interferons to cytokines. J. Biol. Chem. 282: 20059–20063 - PubMed
    1. Levy D. E., Darnell J. E., Jr. 2002. Stats: transcriptional control and biological impact. Nat. Rev. Mol. Cell Biol. 3: 651–662 - PubMed
    1. Quintás-Cardama A., Kantarjian H., Cortes J., Verstovsek S. 2011. Janus kinase inhibitors for the treatment of myeloproliferative neoplasias and beyond. Nat. Rev. Drug Discov. 10: 127–140 - PubMed
    1. Yu H., Pardoll D., Jove R. 2009. STATs in cancer inflammation and immunity: a leading role for STAT3. Nat. Rev. Cancer 9: 798–809 - PMC - PubMed
    1. Vijayakrishnan L., Venkataramanan R., Gulati P. 2011. Treating inflammation with the Janus kinase inhibitor CP-690,550. Trends Pharmacol. Sci. 32: 25–34 - PubMed

Publication types

MeSH terms