. 2012 Oct 5;287(41):34445-54.
doi: 10.1074/jbc.M112.392084. Epub 2012 Aug 17.

Mitochondrial Ca2+ uptake 1 (MICU1) and mitochondrial ca2+ uniporter (MCU) contribute to metabolism-secretion coupling in clonal pancreatic β-cells

Affiliations

Mitochondrial Ca2+ uptake 1 (MICU1) and mitochondrial ca2+ uniporter (MCU) contribute to metabolism-secretion coupling in clonal pancreatic β-cells

Muhammad Rizwan Alam et al. J Biol Chem. .

Abstract

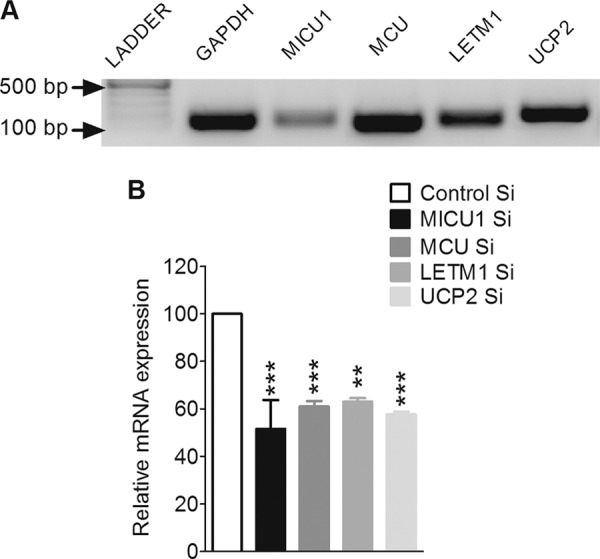
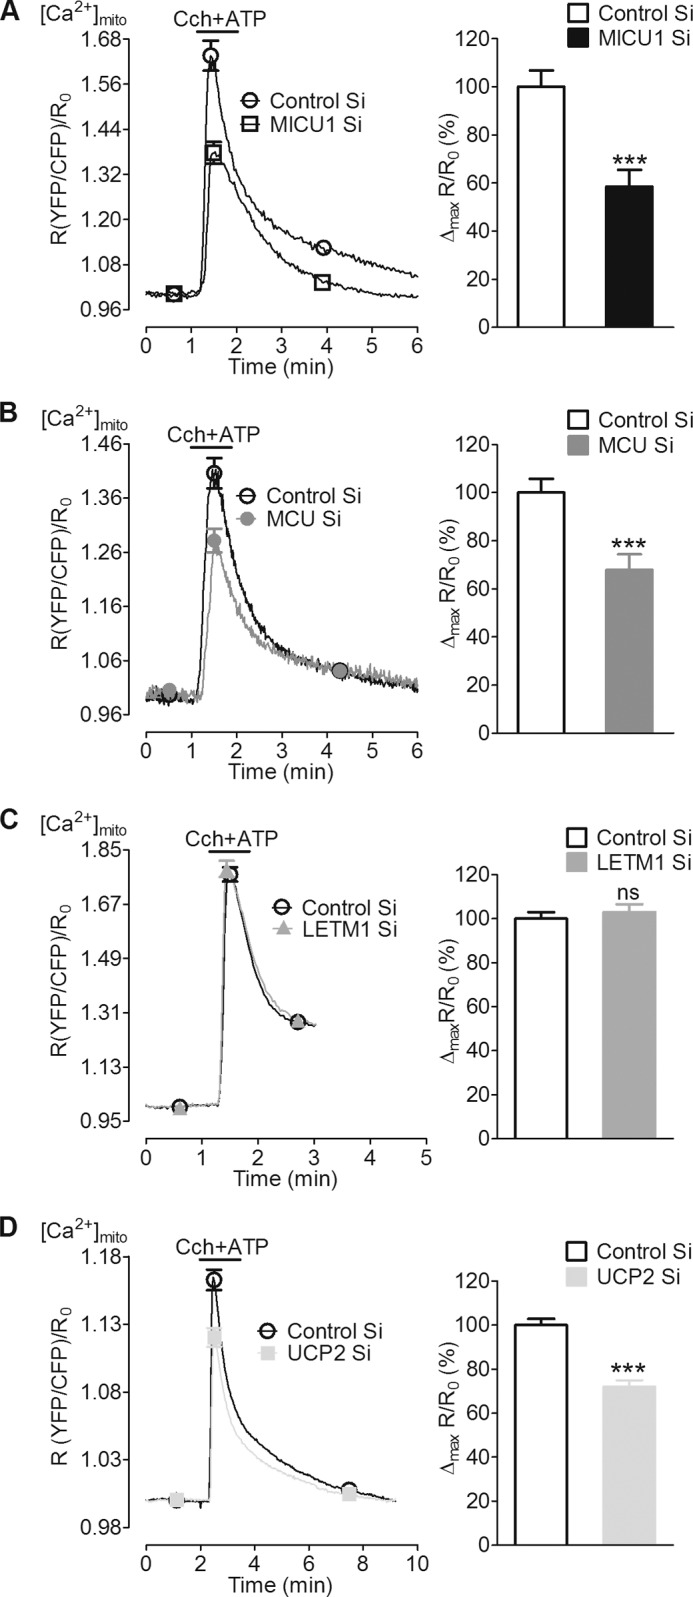
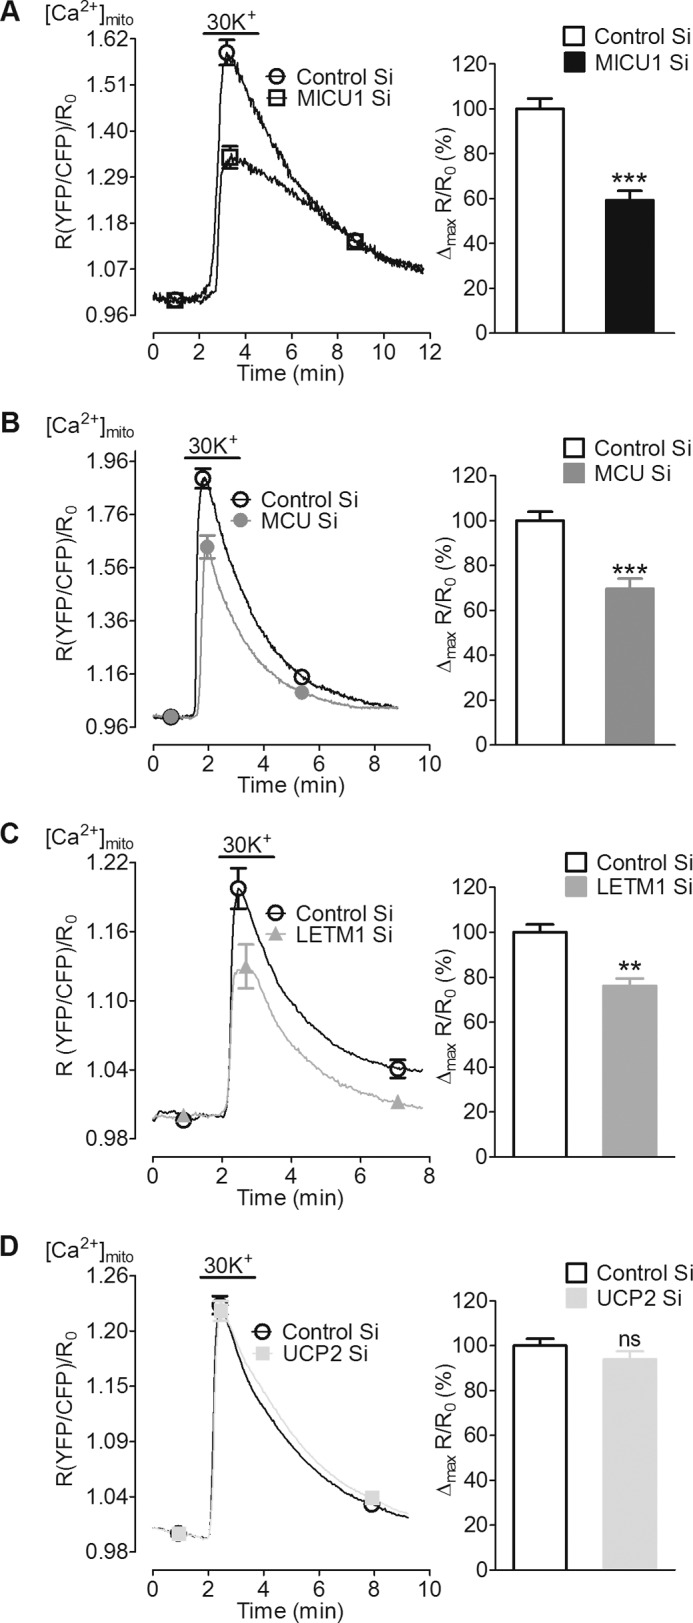
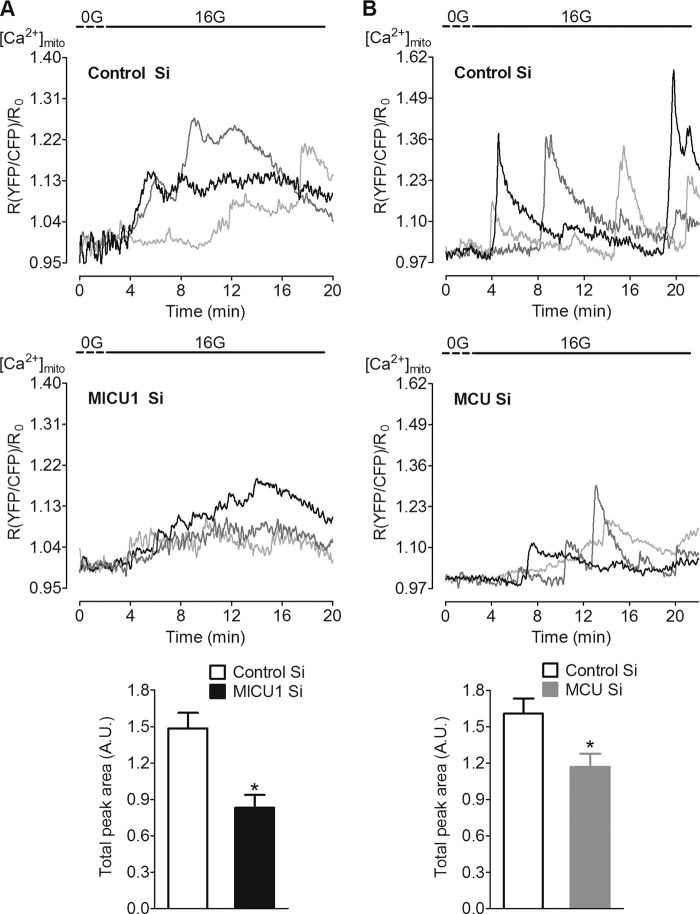
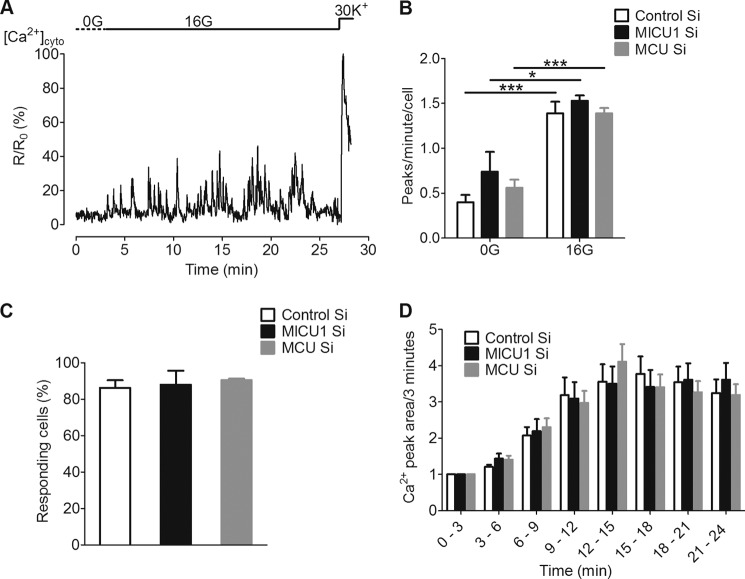
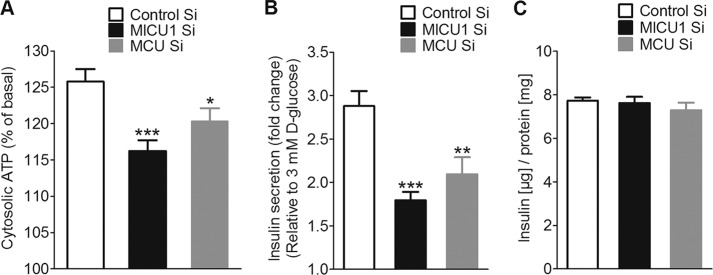
In pancreatic β-cells, uptake of Ca(2+) into mitochondria facilitates metabolism-secretion coupling by activation of various matrix enzymes, thus facilitating ATP generation by oxidative phosphorylation and, in turn, augmenting insulin release. We employed an siRNA-based approach to evaluate the individual contribution of four proteins that were recently described to be engaged in mitochondrial Ca(2+) sequestration in clonal INS-1 832/13 pancreatic β-cells: the mitochondrial Ca(2+) uptake 1 (MICU1), mitochondrial Ca(2+) uniporter (MCU), uncoupling protein 2 (UCP2), and leucine zipper EF-hand-containing transmembrane protein 1 (LETM1). Using a FRET-based genetically encoded Ca(2+) sensor targeted to mitochondria, we show that a transient knockdown of MICU1 or MCU diminished mitochondrial Ca(2+) uptake upon both intracellular Ca(2+) release and Ca(2+) entry via L-type channels. In contrast, knockdown of UCP2 and LETM1 exclusively reduced mitochondrial Ca(2+) uptake in response to either intracellular Ca(2+) release or Ca(2+) entry, respectively. Therefore, we further investigated the role of MICU1 and MCU in metabolism-secretion coupling. Diminution of MICU1 or MCU reduced mitochondrial Ca(2+) uptake in response to d-glucose, whereas d-glucose-triggered cytosolic Ca(2+) oscillations remained unaffected. Moreover, d-glucose-evoked increases in cytosolic ATP and d-glucose-stimulated insulin secretion were diminished in MICU1- or MCU-silenced cells. Our data highlight the crucial role of MICU1 and MCU in mitochondrial Ca(2+) uptake in pancreatic β-cells and their involvement in the positive feedback required for sustained insulin secretion.


Figures

FIGURE 1.
FIGURE 1.
Expression analysis and silencing of MICU1, MCU, LETM1, and UCP2 in INS-1 832/13 cells. A, detection of mRNAs of MICU1, MCU, LETM1, and UCP2 was done by reverse transcription-polymerase chain reaction using a cDNA synthesis kit followed by an amplification with conventional PCR using gene-specific primers. Amplified PCR products were electrophoretically detected on a 1% agarose gel using a 100-bp ladder. GAPDH was used as an internal control. B, efficiency of MICU1 and MCU siRNAs was validated by quantitative real time PCR. Total RNA was isolated 48 or 72 h after transfection with siRNAs against MICU1 (n = 3), MCU (n = 4), LETM1 (n = 3), and UCP2 (n = 3). GAPDH was used as a housekeeping gene. Relative mRNA expression of each gene was compared with respective controls and shown as the percentage of maximum response. ***, p < 0.001, **, p < 0.01 versus respective controls. Control Si, control siRNA.
FIGURE 2.
FIGURE 2.
Silencing of MICU1, MCU, and UCP2 reduced mitochondrial Ca2+ uptake upon intracellular Ca2+ release by carbachol and ATP. INS-1 832/13 cells transiently co-transfected with mtD3cpv (mito-cameleon) and respective siRNAs were used 48 or 72 h after transfection. Cells were perfused with Ca2+-free EB before stimulation. A–D, left panels, mitochondrial Ca2+ ([Ca2+]mito) was measured upon stimulation with a mixture of carbachol (Cch, 100 μm) and ATP (200 μm) in a Ca2+-free buffer. Curves show an average of all cells represented as a ratio of YFP/CFP over time after correction for background and photobleaching. Right panels, peak [Ca2+]mito amplitude was calculated from individual curves and represented as the percentage of control. A and B, suppression of MICU1 and MCU significantly reduced [Ca2+]mito (n = 9). C, LETM1 knockdown could not impact mitochondrial Ca2+ uptake (n = 5). D, UCP2 knockdown also reduced the [Ca2+]mito (n = 13).***, p < 0.001 versus respective control. Control Si, control siRNA. ns, not significant.
FIGURE 3.
FIGURE 3.
Knockdown of MICU1, MCU, and LETM1 reduced mitochondrial Ca2+ uptake of entering Ca2+ upon plasma membrane depolarization with 30 mm KCl. INS-1 832/13 cells transiently co-transfected with 4mtD3cpv (mito-cameleon) and respective siRNAs were used 48 or 72 h after transfection. A–D, left panels, average curves show a fast and transient rise in [Ca2+]mito upon depolarization of cells with 30 mm KCl in the presence of extracellular Ca2+. Curves represent a ratio of YFP/CFP over time after correction for background and photobleaching. Right panels, peak [Ca2+]mito amplitudes were calculated from individual curves and are represented as the percentage of control. A–C, silencing of MICU1 (n = 9), MCU (n = 9), and LETM1 (n = 12) significantly reduced [Ca2+]mito. D, UCP2 suppression did not influence [Ca2+]mito (n = 11).***, p < 0.001, **, p = 0.011 versus respective control. Control Si, control siRNA. ns, not significant.
FIGURE 4.
FIGURE 4.
d-Glucose-triggered mitochondrial Ca2+ uptake was reduced by the knockdown of MICU1 and MCU. INS-1 832/13 cells transiently co-transfected with 4mtD3cpv (mito-cameleon) and respective siRNAs were used 48 or 72 h after transfection. Cells were first kept in 3 mm d-glucose buffer for 30 min followed by 10–15 min of incubation in d-glucose-free buffer before imaging. On the microscope, cells were perfused with d-glucose-free buffer (0G) for 3 min before switching to 16 mm d-glucose (16G) during imaging. A and B, upper and middle panels, three representative curves are shown as a ratio of YFP/CFP over time after correction for background and photobleaching and designate representative traces of [Ca2+]mito from each group. Lower panels, total peak areas (A. U. = arbitrary units) were calculated from all curves and are represented as means ± S.E. Silencing of MICU1 (left lower panel; n = 12, *, p = 0.012) and MCU (right lower panel; n = 10, *, p = 0.011) significantly reduced the total peak area as compared with respective controls. Control Si, control siRNA.
FIGURE 5.
FIGURE 5.
d-Glucose-induced global cytosolic Ca2+ signals were not affected upon silencing of MICU1 and MCU. Cytosolic Ca2+ ([Ca2+]cyto) was measured in INS-1 832/13 cells transiently co-transfected with D3cpv (cyto-cameleon) and respective siRNA 48 or 72 h after transfection. Cells were first kept in 3 mm d-glucose buffer followed by 10–15 min of incubation in d-glucose-free buffer (0G) before imaging. On the microscope, cells were perfused with 0G buffer for 3 min before switching to 16 mm d-glucose (16G) during acquisition. A, representative curve showing [Ca2+]cyto response to 16 mm d-glucose. B, frequency of peaks per cell per min was calculated from each group at 0G and 16G. Switching of cells from 0G to 16G resulted in a significant increase in the frequency of peaks in all groups (n = 5, ***, p < 0.0001, *, p = 0.013 versus control). Frequency of peaks was not different between MICU1 and MCU siRNA-treated cells as compared with control, at both low and high d-glucose (n = 5). Control Si, control siRNA. C, the percentage of cells responding to 16 mm d-glucose was calculated from each group and was unaffected in MICU- and MCU-silenced cells (n = 5). D, Ca2+ peak area/3 min estimated by the addition of all values on y axis for every 3 min over the whole measurement period after normalizing the individual curves for background and photobleaching. Values in each time period were presented as -fold change as compared with basal (0–3 min). MICU1 and MCU knockdown did not affect the Ca2+ peak area over the whole period of measurement as compared with control (n = 5).
FIGURE 6.
FIGURE 6.
d-Glucose-triggered increase in cytosolic ATP and insulin secretion was significantly reduced in MICU1 and MCU knockdown cells. Cytosolic ATP [ATP]cyto was measured in INS-1 832/13 cells co-transfected with cytosolic luciferase and respective siRNAs. Cells were preincubated in 3 mm d-glucose (3G) before switching to 16 mm d-glucose (16G). A, peak [ATP]cyto at 16 mm d-glucose expressed as the percentage of 3 mm glucose. Silencing of MICU1 and MCU significantly reduced cytosolic ATP (n = 32, ***, p < 0.0001,*, p = 0.032 versus control). Control Si, control siRNA. B, insulin secretion was measured in INS-1 832/13 cells 48 or 72 h after transfection with respective siRNAs. Cells were first incubated in 3 mm d-glucose for 1 h followed by a 1-h treatment with 16 mm d-glucose. GSIS was expressed as -fold change over basal upon silencing of MICU1 (n = 28; *, p < 0.05 versus control) and MCU (n = 12; ***, p < 0.0001, **, p < 0.01 versus control). C, total cellular insulin content measured from lysates of cells transfected with MICU1/MCU was not different from control (n = 3).

Similar articles

Cited by

References

    1. Wiederkehr A., Park K. S., Dupont O., Demaurex N., Pozzan T., Cline G. W., Wollheim C. B. (2009) Matrix alkalinization: a novel mitochondrial signal for sustained pancreatic β-cell activation. EMBO J. 28, 417–428 - PMC - PubMed
    1. Joseph J. W., Jensen M. V., Ilkayeva O., Palmieri F., Alárcon C., Rhodes C. J., Newgard C. B. (2006) The mitochondrial citrate/isocitrate carrier plays a regulatory role in glucose-stimulated insulin secretion. J. Biol. Chem. 281, 35624–35632 - PubMed
    1. Kibbey R. G., Pongratz R. L., Romanelli A. J., Wollheim C. B., Cline G. W., Shulman G. I. (2007) Mitochondrial GTP regulates glucose-stimulated insulin secretion. Cell Metab. 5, 253–264 - PMC - PubMed
    1. Wiederkehr A., Szanda G., Akhmedov D., Mataki C., Heizmann C. W., Schoonjans K., Pozzan T., Spät A., Wollheim C. B. (2011) Mitochondrial matrix calcium is an activating signal for hormone secretion. Cell Metab. 13, 601–611 - PubMed
    1. Robb-Gaspers L. D., Burnett P., Rutter G. A., Denton R. M., Rizzuto R., Thomas A. P. (1998) Integrating cytosolic calcium signals into mitochondrial metabolic responses. EMBO J. 17, 4987–5000 - PMC - PubMed

Publication types

MeSH terms