Comparative Study
. 2012 Aug 17;12(8):11.
doi: 10.1167/12.8.11.

Individual and age-related variation in chromatic contrast adaptation

Affiliations
Comparative Study

Individual and age-related variation in chromatic contrast adaptation

Sarah L Elliott et al. J Vis. .

Abstract

Precortical color channels are tuned primarily to the LvsM (stimulation of L and M cones varied, but S cone stimulation held constant) or SvsLM (stimulation of S cones varied, but L and M cone stimulation held constant) cone-opponent (cardinal) axes, but appear elaborated in the cortex to form higher-order mechanisms tuned to both cardinal and intermediate directions. One source of evidence for these higher-order mechanisms has been the selectivity of color contrast adaptation for noncardinal directions, yet the degree of this selectivity has varied widely across the small sample of observers tested in previous studies. This study explored the possible bases for this variation, and in particular tested whether it reflected age-related changes in the distribution or tuning of color mechanisms. Observers included 15 younger (18-22 years of age) and 15 older individuals (66-82), who adapted to temporal modulations along one of four chromatic axes (two cardinal and two intermediate axes) and then matched the hue and contrast of test stimuli lying along eight different directions in the equiluminant plane. All observers exhibited aftereffects that were selective for both the cardinal and intermediate directions, although selectivity was weaker for the intermediate axes. The degree of selectivity increased with the magnitude of adaptation for all axes, and thus adaptation strength alone may account for much of the variance in selectivity among observers. Older observers showed a stronger magnitude of adaptation thus, surprisingly, more conspicuous evidence for higher-order mechanisms. For both age groups the aftereffects were well predicted by response changes in chromatic channels with linear spectral sensitivities, and there was no evidence for weakened channel tuning with aging. The results suggest that higher-order mechanisms may become more exposed in observers or conditions in which the strength of adaptation is greater, and that both chromatic contrast adaptation and the cortical color coding it reflects remain largely intact in the aging visual system.


Figures

Figure 1
Figure 1
(a) Spatial arrangement for the asymmetric matching task (Webster & Mollon, 1994). Observers viewed modulation along one chromatic axis of the color space (b) in the 2° field above fixation. Test stimuli were presented in the same field and observers matched the perceived color by adjusting the contrast and hue of the matching stimulus presented in the neutral-adaptation field below fixation. (b) An equiluminant plane of a three-dimensional cone-opponent space. (c) The test (black symbols) and adaptation (white symbols) CIE chromaticity coordinates. The colored triangle illustrates colors within the CRT gamut.
Figure 2
Figure 2
The mean chromatic contrast match for each younger and older observer across the four separately matched ±LvsM and ±SvsLM pairs.
Figure 3
Figure 3
Mean matches plotted for individual young (black squares) or old (red circles) observers under neutral adaptation. The error bars show the standard deviation of these means for each age group (black and red for young and older, respectively), and are plotted as the Cartesian distances from the mean match along either the hue or contrast axis. To avoid clutter the bars have been displaced toward (old, red) or away (young, black) from the origin.
Figure 4
Figure 4
Mean color changes within the equiluminant plane (symbols) and the corresponding ellipse fits (solid lines) are plotted in the top panel for the two age groups. The shifts in perceived hue (test hue angle – matched hue angle) for the two age groups are plotted in the bottom panel. Each axis of adaptation is shown separately. Black and red symbols are for the younger and older age groups, respectively. Error bars are ±1 SEM for contrast matches in the top panel, and for matched hue angle in the bottom panel.
Figure 5
Figure 5
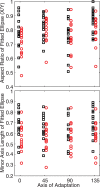
Black and red symbols denote younger and older observers, respectively. The top panel illustrates the aspect ratios of the fitted ellipses; the bottom panel illustrates the minor axis fits for each individual observer plotted as a function of the axis of adaptation. Black and red symbols are shifted slightly for clarity.
Figure 6
Figure 6
Black and red symbols denote younger and older observers, respectively. (a) The mean cardinal axes aspect ratio vs. the mean intermediate axes ratios for each individual observer. The solid black line is a line of unity. (b) The aspect ratio of the fitted ellipse vs. the area of the fitted ellipse for each individual observer for the 45–225° (squares) and 135–315° (circles) axes.
Figure 7
Figure 7
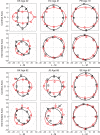
Color changes within the equiluminant plane for three younger (top panel) and three older (bottom panel) observers. The top row in each panel illustrates changes following adaptation to the LvsM (0–180°, black symbols) and SvsLM (90–270°, red symbols) axes. The bottom panel illustrates changes following adaptation to the 45–225° (black symbols) and 135–315° axes (red symbols). Solid lines denote the ellipse fit to each adaptation condition. The black dotted lines illustrate the cardinal axes and the contrast and hue angles of the eight test stimuli. Error bars are ±1 SEM for contrast matches, only. Standard errors for hue matches are shown in Figure 8.
Figure 8
Figure 8
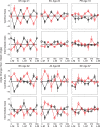
Shifts in perceived hue (test hue angle – matched hue angle) measured for the six sample observers in Figure 7. Panels and symbols are the same as Figure 7. The horizontal black line indicates a perfect hue angle match. Error bars are ±1 SEM for the matched hue angle.
Figure 9
Figure 9
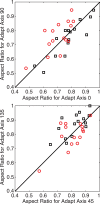
Black and red symbols denote younger and older observers, respectively. The top and bottom panel illustrate differences in aspect ratios for the two cardinal axes and the two intermediate axes, respectively. The solid black line is a line of unity.

References

    1. Anstis S., Cavanagh P. (1983). A minimum motion technique for judging equiluminance. In Mollon J. D., Sharpe L. T.(Eds.), Color vision. (pp 155–166). London: Academic.
    1. Baker C. L., Mareschal I. (2001). Processing of second-order stimuli in the visual cortex. Progressive Brain Research , 134, 171–191. - PubMed
    1. Belmore S. C., Shevell S. K. (2008). Very-long-term chromatic adaptation: Test of gain theory and a new method. Visual Neuroscience , 25(3), 411–414. - PubMed
    1. Betts L. R., Sekular A. B., Bennett P. J. (2007). The effects of aging on orientation discrimination. Vision Research, 47, 1769–1780. - PubMed
    1. Billino J., Bremmer F., Gegenfurtner K. R. (2008). Differential aging of motion processing mechanisms: Evidence against general perceptual decline. Vision Research, 48, 1254–1261. - PubMed

Publication types