. 2012;10(8):e1001374.
doi: 10.1371/journal.pbio.1001374. Epub 2012 Aug 14.

Haemodynamics-driven developmental pruning of brain vasculature in zebrafish

Affiliations

Haemodynamics-driven developmental pruning of brain vasculature in zebrafish

Qi Chen et al. PLoS Biol. 2012.

Abstract

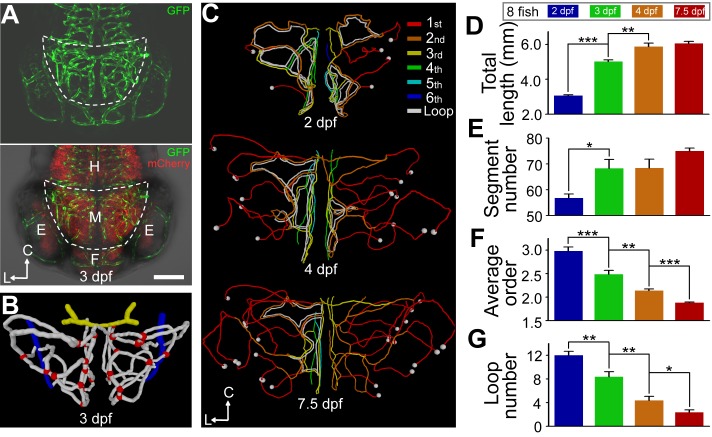
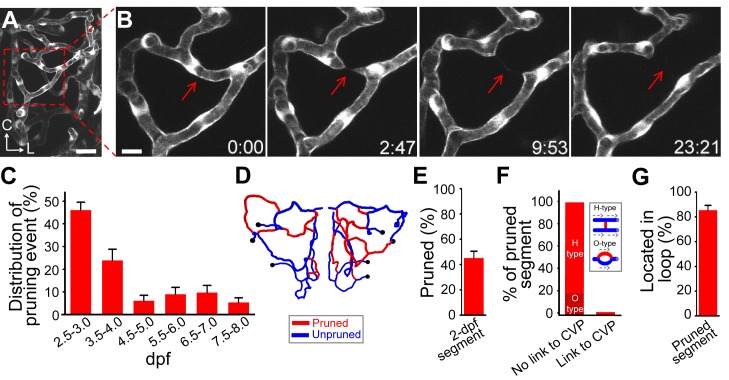
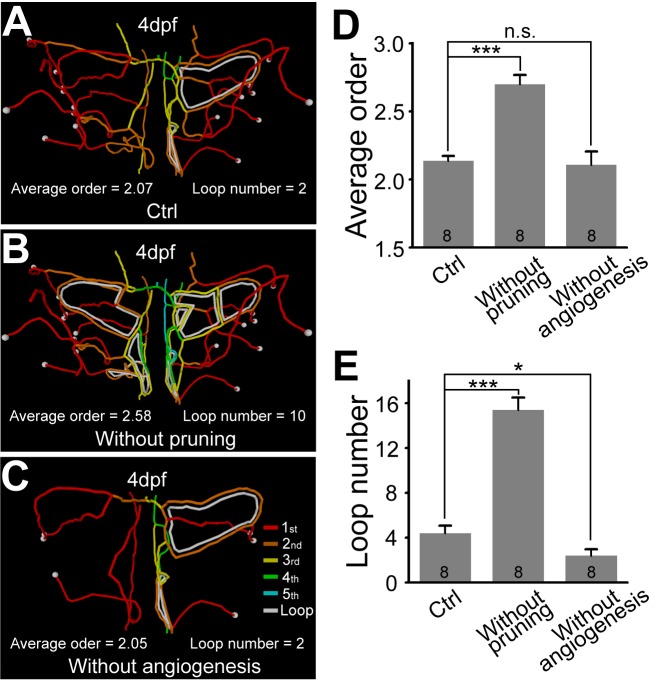
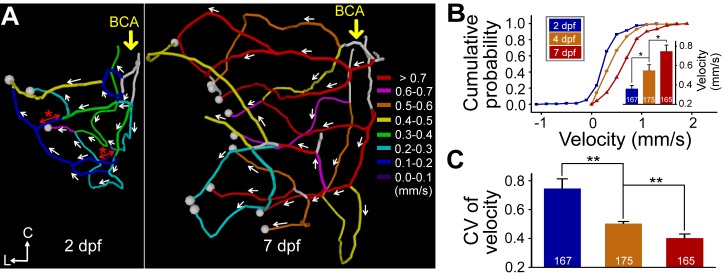
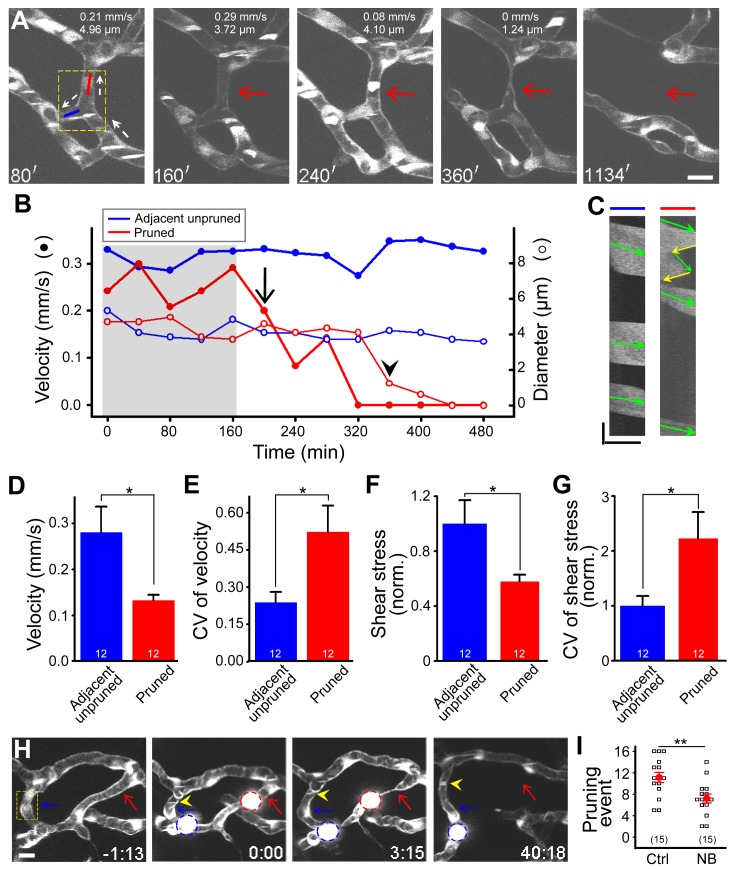
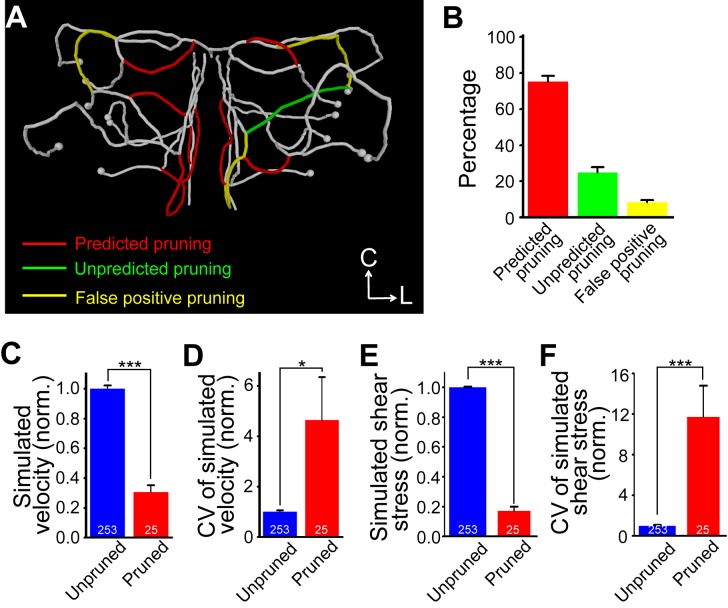
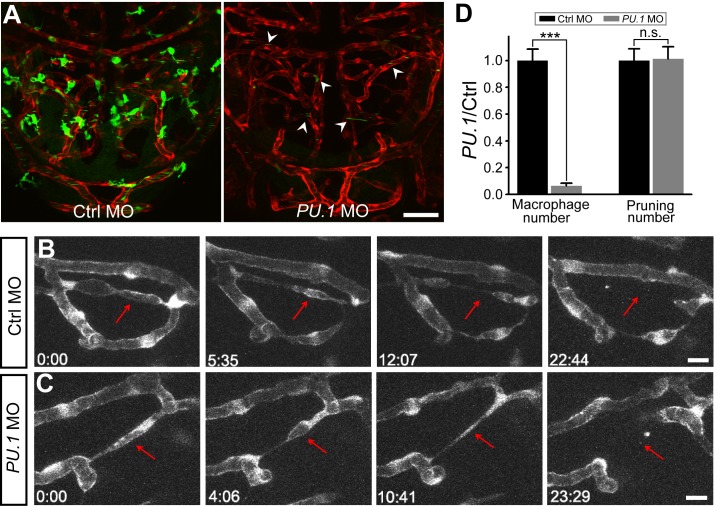
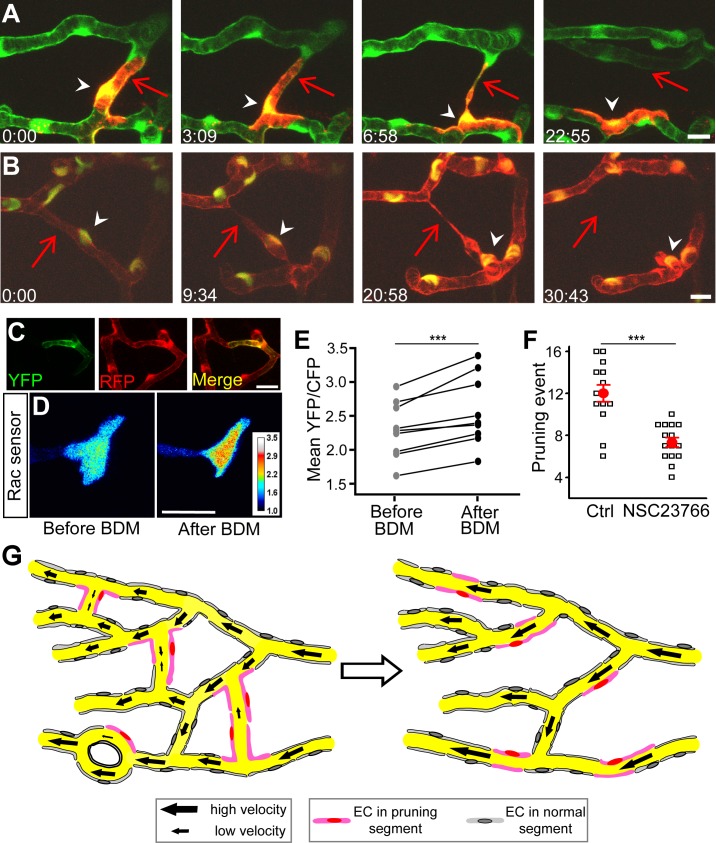
The brain blood vasculature consists of a highly ramified vessel network that is tailored to meet its physiological functions. How the brain vasculature is formed has long been fascinating biologists. Here we report that the developing vasculature in the zebrafish midbrain undergoes not only angiogenesis but also extensive vessel pruning, which is driven by changes in blood flow. This pruning process shapes the initial exuberant interconnected meshwork into a simplified architecture. Using in vivo long-term serial confocal imaging of the same zebrafish larvae during 1.5-7.5 d post-fertilization, we found that the early formed midbrain vasculature consisted of many vessel loops and higher order segments. Vessel pruning occurred preferentially at loop-forming segments via a process mainly involving lateral migration of endothelial cells (ECs) from pruned to unpruned segments rather than EC apoptosis, leading to gradual reduction in the vasculature complexity with development. Compared to unpruned ones, pruned segments exhibited a low and variable blood flow, which further decreased irreversibly prior to the onset of pruning. Local blockade of blood flow with micro-bead obstruction led to vessel pruning, whereas increasing blood flow by noradrenergic elevation of heartbeat impeded the pruning process. Furthermore, the occurrence of vessel pruning could be largely predicted by haemodynamics-based numerical simulation of vasculature refinement. Thus, changes of blood flow drive vessel pruning via lateral migration of ECs, leading to the simplification of the vasculature and possibly efficient routing of blood flow in the developing brain.


Conflict of interest statement

The authors have declared that no competing interests exist.

Figures

Figure 1
Figure 1. Structure changes of zebrafish midbrain vasculature during development.
(A) Projected confocal images of a 3-dpf Tg(kdrl:eGFP,HuC:gal4-uas-mCherry) zebrafish larva showing the brain blood vasculature (green) and neural tissue (red, bottom). The dashed lines delineate the midbrain position. C, caudal; L, lateral; E, eye; F, forebrain; H, hindbrain; M, midbrain. Dorsal view, caudal is up. The same orientation is used for images and centerlines of whole-midbrain vasculature in all of the following figures. Scale, 100 µm. (B) 3-D reconstruction of the basal communicating artery (BCA, yellow), midbrain vasculature (white), and choroidal vascular plexus (CVP, blue) in the brain shown in (A). Red dots represent the branch points between vessel segments in the midbrain. (C–G) Developmental expansion and simplification of the midbrain vasculature. The data were obtained from eight larvae with each imaged at 2.0, 3.0, 4.0, and 7.5 dpf. (C) Representative midbrain vasculature centerlines of a larva at 2.0 (top), 4.0 (middle), and 7.5 dpf (bottom). Red, orange, yellow, green, cyan, and blue mark vessel segments with the 1st–6th Strahler order, respectively. The white lines indicate internal vessel loops, and the white dots represent branch points between the CVP and midbrain vessel segments. (D–G) Summary of developmental changes in the total vessel length (D), segment number (E), weighted average segment Strahler order (F), and internal loop number (G) of the midbrain vasculature. * p<0.05; ** p<0.01; *** p<0.001 (paired Student's t test). Error bars, ± SEM.
Figure 2
Figure 2. Occurrence of vessel pruning in the midbrain vasculature during development.
(A) Projected confocal image of a left midbrain vasculature in a 3-dpf Tg(kdrl:eGFP) larva. (B) Serial images showing that a vessel segment (arrow) underwent pruning in the midbrain vasculature shown in (A, square). Time, hour:minute. Scales, 25 µm in (A) and 10 µm in (B). (C) Temporal distribution of vessel pruning events observed from eight larvae at each data point. (D and E) An example (D) and summary (E) of data showing that vessel segments formed at 2-dpf underwent extensive pruning during 2.0–7.0 dpf. The data in (E) were obtained from six larvae. (D) Centerline of a 2-dpf midbrain vasculature in which red and blue mark segments were pruned or unpruned during 2.0–7.0 dpf, respectively. The black dots represent branch points between the CVP and midbrain vessel segments. (F and G) Local structural features of pruned vessel segments. (F) Percentages of pruned segments that did not link to the CVP and were located in H-type (87/107) or O-type (19/107) of vascular microcircuits or directly linked to the CVP (1/107). The data were obtained from 18 larvae. Inset, schematic of H-type and O-type of vascular microcircuits. The dashed arrows in the inset indicate the direction of blood flow, and the red and blue lines represent pruned and unpruned vessel segments, respectively. (G) Percentage of pruned segments that were located in internal vessel loop. Error bars, ± SEM.
Figure 3
Figure 3. Vessel pruning reduces the complexity of the midbrain vasculature during development.
(A–C) Representative centerline of 4-dpf midbrain vasculature under control condition (A), without pruning (B), or without angiogenesis (C). Red, orange, yellow, green, and cyan mark the vessel segments with the 1st–5th Strahler order, respectively. The white lines indicate internal vessel loops, and the white dots represent branch points between the CVP and midbrain vessel segments. (D and E) Summary of the average segment Strahler order (D) and internal loop number (E) of 4-dpf midbrain vasculatures under control (“Ctrl”) condition or when artificially removing vessel pruning (“Without pruning”) or angiogenesis (“Without angiogenesis”) occurring between 2.0 and 4.0 dpf. The data were obtained from eight larvae. n.s., no significance; * p<0.05; *** p<0.001 (paired Student's t test). Error bars, ± SEM.
Figure 4
Figure 4. Developmental facilitation of the midbrain blood flow.
(A) Representative spatial maps of blood flow velocity in a half midbrain vasculature of a larva at 2.0 dpf (left) and 7.0 dpf (right). The white arrows indicate the direction of blood flow in each vessel segment examined, and the red lines with an arrowhead at each end show bi-directional flow (asterisk). The large yellow arrows indicate the blood flow input from the BCA. The velocities were color-coded. The white lines indicate the segments to which line scanning was inaccessible (Materials and Methods). The white dots represent branch points between the CVP and midbrain vessel segments. (B and C) Summary of cumulative distribution (B) and variation (C) of flow velocity among different vessel segments in eight half midbrains of seven larvae with each imaged at 2.0, 4.0, and 7.0 dpf. The inset in (B) shows average values of flow velocities. The numbers on the bars represent the number of vessel segments examined. * p<0.05; ** p<0.01 (Student's t test). Error bars, ± SEM.
Figure 5
Figure 5. Changes in blood flow trigger vessel pruning.
(A–G) Changes in blood flow before and during vessel pruning. (A–C) Data obtained from the same vessel segments. (A) Representative of simultaneous serial imaging and axial line scanning of midbrain vessels in a 2-dpf Tg(kdrl:eGFP,PU.1:gal4-uas-GFP) larva. Red and blue lines in the first panel indicate the site where axial line scanning was performed on a pruned (red arrow) and its adjacent unpruned segments, respectively. The numbers on the top of each panel represent the blood flow velocity and segment diameter of the pruned vessel segment. The white dashed arrows indicate blood flow direction. White signals in vessels were originated from moving blood cells that expressed GFP. The dashed square in the first panel marks the position from which blood flow is shown in Video S5. (B) Example showing changes with time of the blood flow velocity (filled circle) and diameter (open circle) of pruned (red) and adjacent unpruned (blue) segments before and during vessel pruning. The arrow and arrowhead mark the time point when the blood flow velocity showed an irreversible drop or the segment exhibited an obvious reduction in diameter, respectively. (C) Representative of kymographs showing bi-directional flow in the pruned segment (right) and uni-directional flow in an adjacent unpruned segment (left). The data were obtained from the pruned (red line) and unpruned (blue line) segments in (A) at the time point of 80 min. Green arrows indicate forward movement of blood cells, and yellow ones (right) indicate reverse flow in the pruned segment. (D and E) Average magnitude (D) and coefficient of variation (E) of flow velocities among different time points in pruned and adjacent unpruned segments before the time when an irreversible drop of flow velocity in pruned segments occurred (as indicated by the shadow region in B). The numbers on the bars represent the numbers of segments examined. (F and G) Normalized average magnitude (F) and coefficient of variation (G) of shear stress among different time points in pruned and adjacent unpruned segments before the time when an irreversible drop of flow velocity in pruned segments occurred (as indicated by the shadow region in B). (H and I) Effects of blood flow manipulation on vessel pruning. (H) Representative of serial imaging showing that the obstruction of blood flow by beads triggered vessel pruning. The beads were loaded several minutes before the time zero via the duct of Cuvier microinjection. The red and blue circles mark the beads that were successful or failed to block blood flow, respectively. The red and blue arrows mark the pruned and unpruned segments, respectively. The yellow arrowheads represent moving blood cells in the vessel segment in which a bead (blue circle) failed to block the blood flow. (I) Effects of norepinephrine bitartrate (NB) treatment at 2.0 dpf for 24 h on the occurrence of vessel pruning per larva. Each symbol represents data obtained from one larva. Scales, 10 µm in (A), 5.89 µm (x-axis) and 143 ms (y-axis) in (C) and 10 µm in (H). * p<0.05; ** p<0.01 (Student's t test). Error bars, ± SEM.
Figure 6
Figure 6. Prediction of vessel pruning by haemodynamics-based numerical simulation of vasculature refinement.
(A) Representative centerline of a 3-dpf midbrain vasculature. Red, green and yellow mark vessel segments that were correctly predicted (“predicted pruning”), unpredicted (“unpredicted pruning”), or falsely predicted (“false positive pruning”) to be pruned, respectively. (B) Summary data obtained from seven simulated vasculature. (C and D) Average magnitude (C) and coefficient of variation (D) of simulated flow velocity in unpruned and pruned vessel segments. (E and F) Average magnitude (E) and coefficient of variation (F) of simulated shear stress in unpruned and pruned segments. The numbers on the bars represent the numbers of vessel segments simulated. * p<0.05; *** p<0.001 (Student's t test). Error bars, ± SEM.
Figure 7
Figure 7. Macrophages are not required for vessel pruning.
(A) Projected confocal images showing midbrain vasculature (red) and macrophages (green) in control MO- (left) and PU.1 MO-injected (right) Tg(kdrl:RFP,PU.1:gal4-uas-GFP) larvae at 3 dpf. The green signals in the vessels (arrowheads) were originated from non-specific expression of GFP in blood cells. (B and C) Representative of serial images showing vessel pruning (arrows) in a control MO- (B) and PU.1 MO-injected (C) larvae. (D) Summary of PU.1 knockdown effects on macrophage development and vessel pruning occurrence in the zebrafish midbrain. The data were obtained from 16 larvae in each group. Scales, 50 µm in (A) and 10 µm in (B). n.s., no significance; *** p<0.001 (Student's t test). Error bars, ± SEM.
Figure 8
Figure 8. Vessel pruning is associated with endothelial cell migration and involves Rac1 activity.
(A and B) Representative of tracing of single EC (A) or EC nuclei (B) showing that ECs (arrowheads) in pruned segments (arrows) migrated to adjacent unpruned segments during vessel pruning. The mCherry was mosaically expressed in single ECs of Tg(kdrl:eGFP) embryos (A), and Tg(kdrl:RFP,fli1:nEGFP) larvae were used to trace single EC nuclei (B, yellow). The arrows mark pruned vessel segments, and the arrowheads mark a migrating EC (A) or EC nucleus (B). Scales, 10 µm in (A and B). (C) Mosaic expression of the Raichu Rac1 FRET sensor in vascular endothelial cells of Tg(kdrl:RFP) zebrafish brain. YFP and RFP signals indicate FRET sensor and vascular endothelial cells, respectively. (D) Representative images showing the emission ratio (YFP/CFP) of the same EC expressing Rac1 FRET sensor before and after blood flow reduction induced by 30-min BDM treatment. The intensity of Rac1 FRET signal is color-coded. (E) Summary of data. Data obtained from the same EC are connected by a line. (F) Effect of NSC23766 treatment on the occurrence of vessel pruning per larva. NSC23766 was applied from 2 to 3 dpf and the pruning event was examined between 2 and 3 dpf. Each open symbol represents data obtained from one larva, and the red ones represent the mean values. (G) Working model. In the primitive vasculature (left), some vessel segments exhibit low and unstable blood flow, and ECs located at these segments (pink) undergo lateral migration, leading to vessel pruning. This pruning consequently results in the formation of a simplified vasculature with reduced numbers of internal vessel loop and segment Strahler order (right). Scales, 20 µm in (C) and (D). *** p<0.001 (paired Student's t test in E and unpaired Student's t test in F). Error bars, ± SEM.

Comment in

  • Pruning brain vasculature for efficiency.
    Sedwick C. Sedwick C. PLoS Biol. 2012;10(8):e1001375. doi: 10.1371/journal.pbio.1001375. Epub 2012 Aug 14. PLoS Biol. 2012. PMID: 22927793 Free PMC article. No abstract available.

References

    1. Zlokovic BV (2008) The blood-brain barrier in health and chronic neurodegenerative disorders. Neuron 57: 178–201. - PubMed
    1. Padget DH (1956) The cranial venous system in man in reference to development, adult configuration, and relation to the arteries. Am J Anat 98: 307–355. - PubMed
    1. Zacchigna S, Lambrechts D, Carmeliet P (2008) Neurovascular signalling defects in neurodegeneration. Nat Rev Neurosci 9: 169–181. - PubMed
    1. Greenberg DA, Jin K (2005) From angiogenesis to neuropathology. Nature 438: 954–959. - PubMed
    1. Tam SJ, Watts RJ (2010) Connecting vascular and nervous system development: angiogenesis and the blood-brain barrier. Annu Rev Neurosci 33: 379–408. - PubMed

Publication types

MeSH terms