

Comparative studies on the ecophysiological differences of two green tide macroalgae under controlled laboratory conditions
- PMID: 22905087
- PMCID: PMC3414491
- DOI: 10.1371/journal.pone.0038245
Comparative studies on the ecophysiological differences of two green tide macroalgae under controlled laboratory conditions
Abstract
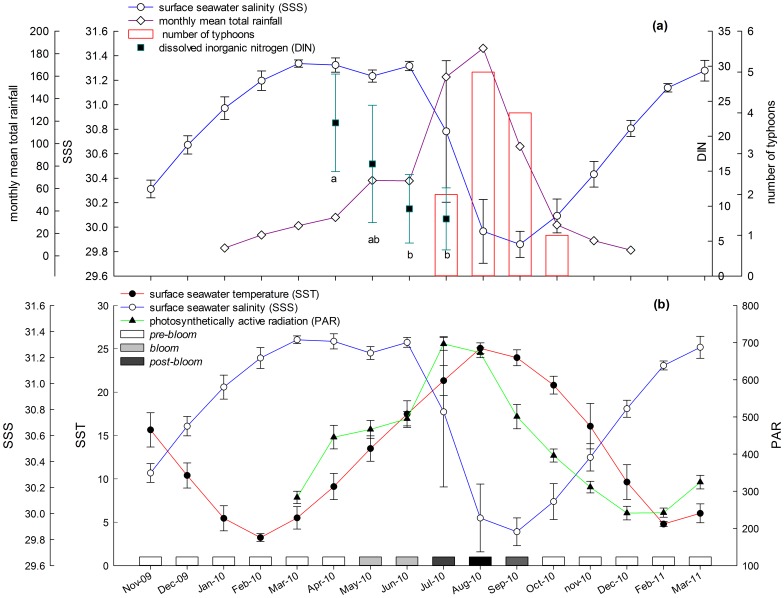
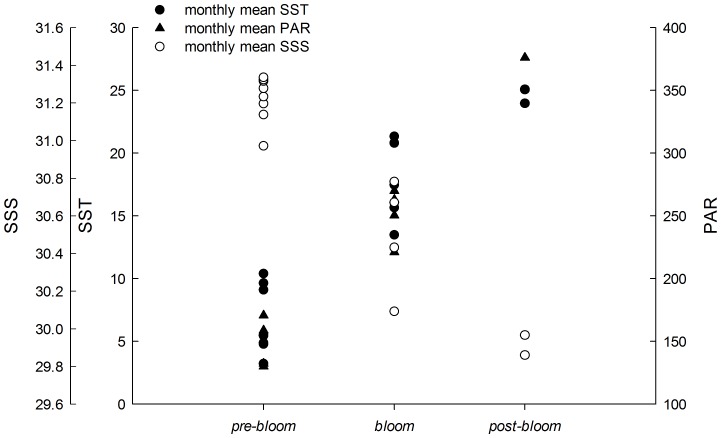
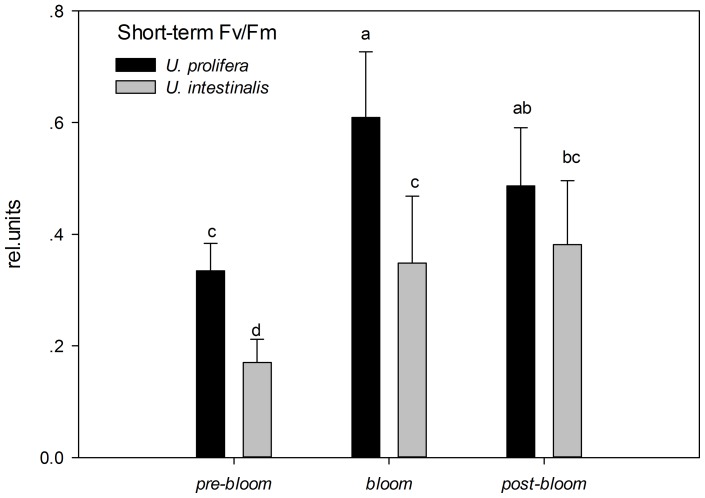
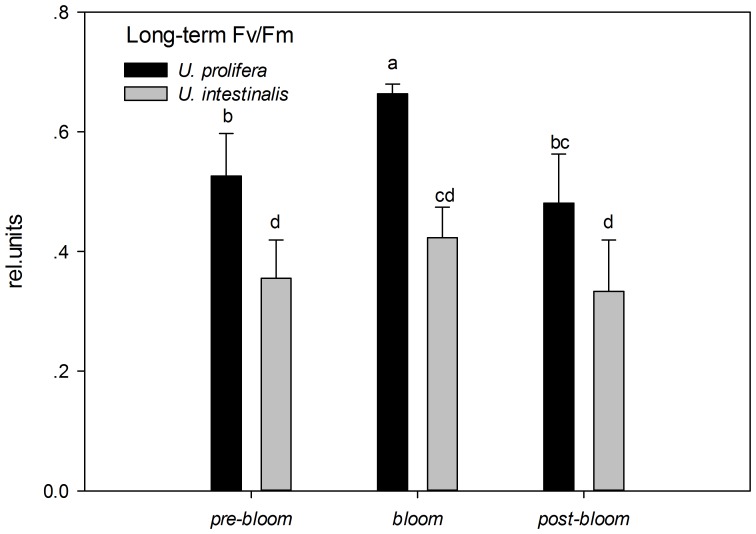
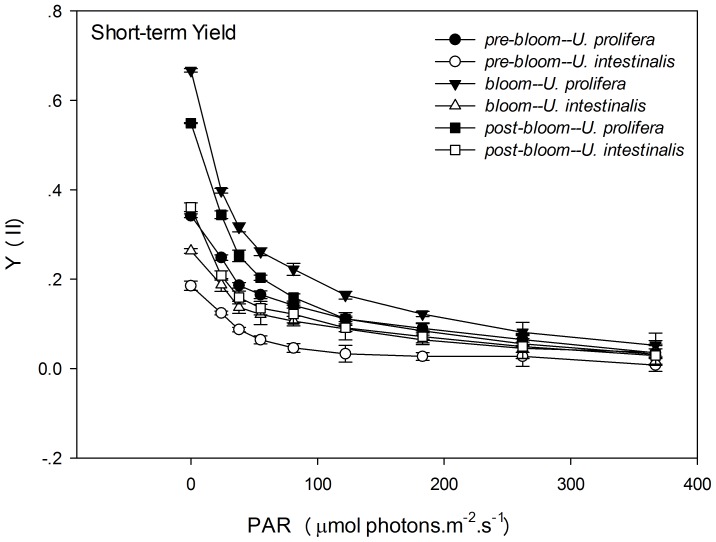
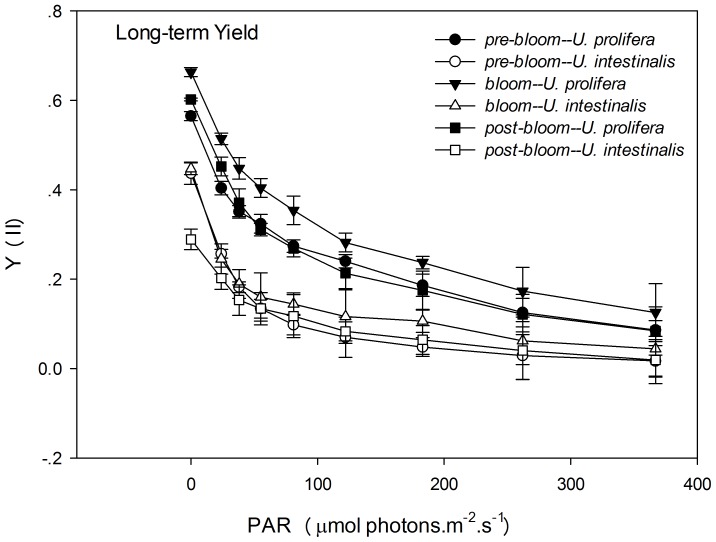
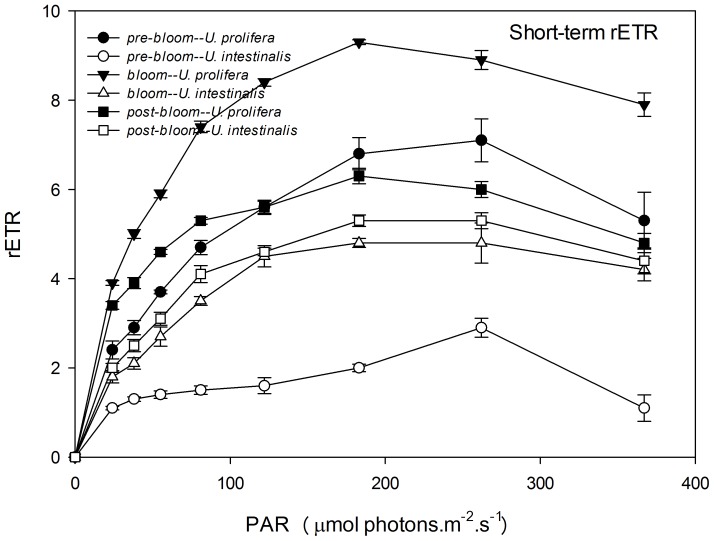
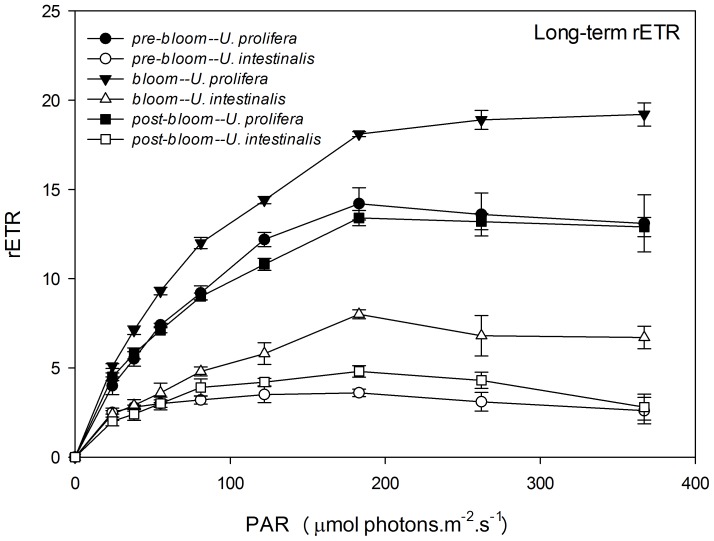
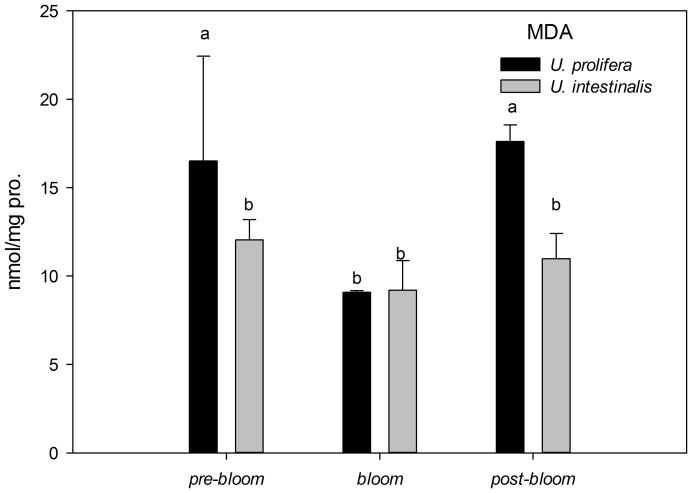
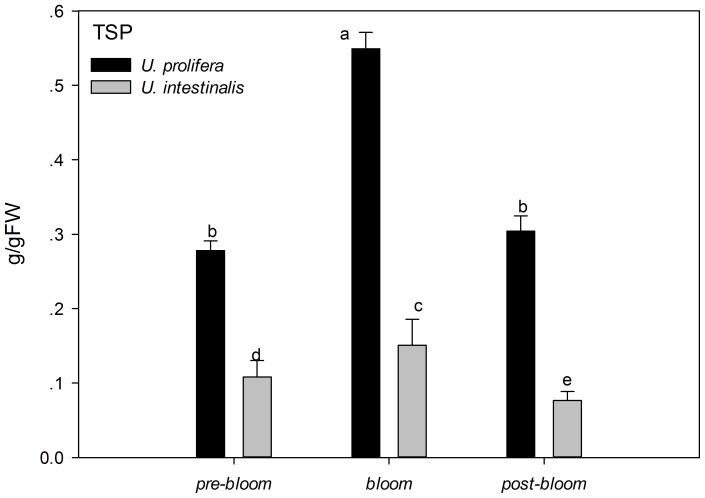
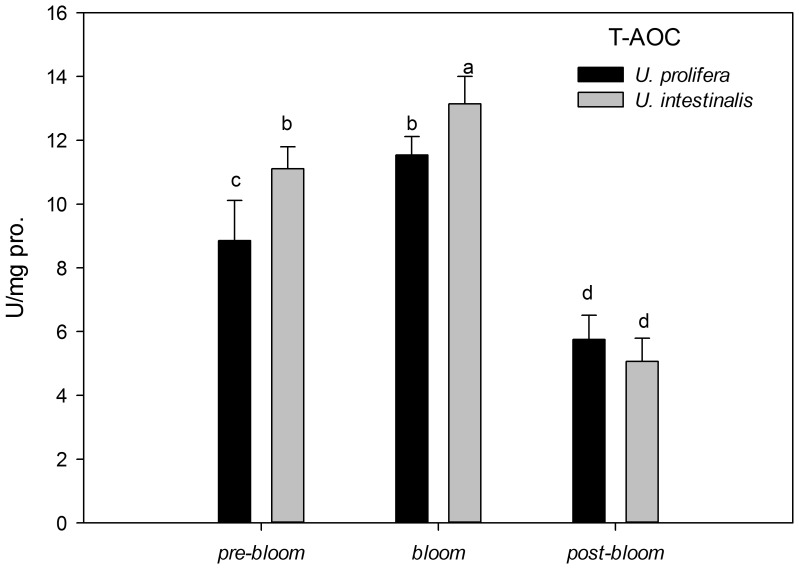
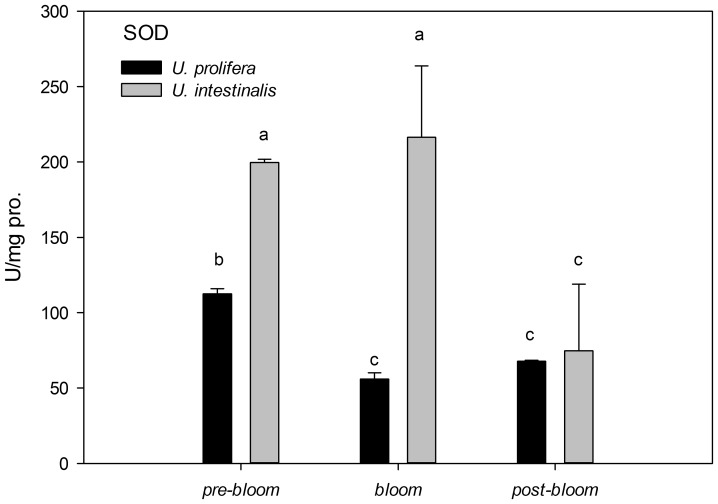
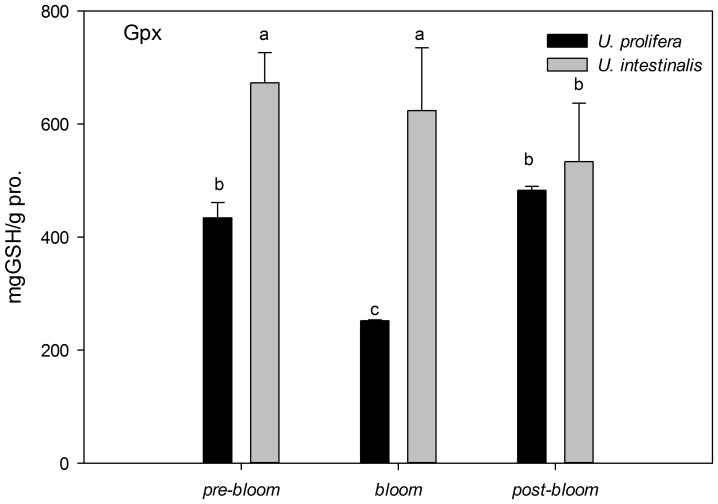
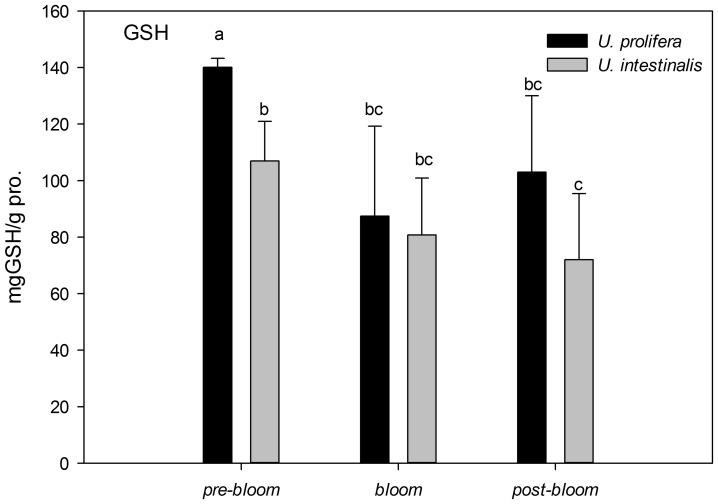
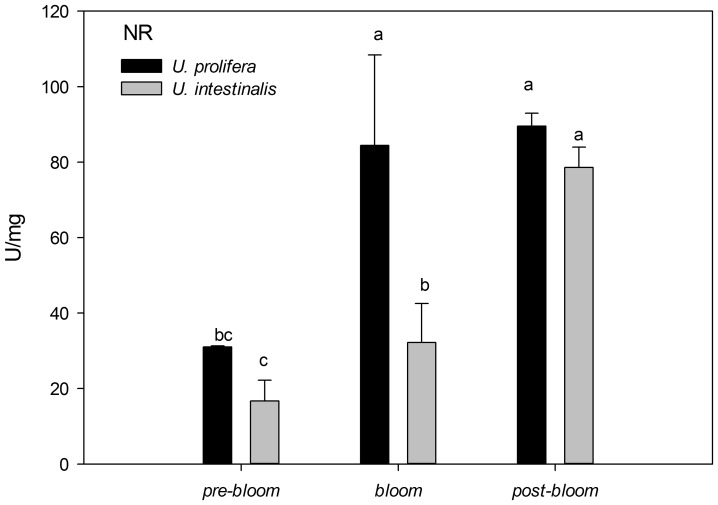
Yellow Sea green tides have occurred in coastal China almost every year from 2007 to 2011. Ulva prolifera (Müller) J. Agardh has been identified as the causative macroalgal species. U. intestinalis, however, has been observed in the bloom areas, co-occurring with U. prolifera, but it has not been found to be causative. The Yellow Sea green tide has shown consistent phases of development that match corresponding environmental changes. U. prolifera, not U. intestinalis, is dominant. Our experimental design was based on these observed phenomena, and the results of our field investigation indicated a close relationship between changes in principal environmental factors (irradiance, temperature, and salinity) and the development of each phase of the bloom. These main environmental factors were simulated to allow estimation and comparison of the physiological responses of U. prolifera and U. intestinalis. Ecophysiological differences were found between these two species. (1) More photosynthetic activity and plasticity were detected in U. prolifera. (2) U. prolifera was found to be more sensitive to dynamic environments, especially harsh and changing environmental conditions. U. intestinalis was found to be more stable, probably due to the higher stress tolerance given by its antioxidant system. (3) Markedly higher nutrient absorption activity was observed in U. prolifera. Comparisons of the ecophysiological traits of these two species in this present study may foster understanding of their natural ecological processes. Specifically, U. prolifera seemed to be more engaged with the ephemeral blooms, while U. intestinalis seemed to be directed toward persistence. This also suggests that the ecological success of U. prolifera may be inextricably linked to its higher capacity for photosynthesis, nutrient absorption, and nutrient assimilation.
Conflict of interest statement
Figures
Similar articles
-
Microplastics in bloom-forming macroalgae: Distribution, characteristics and impacts.J Hazard Mater. 2020 Oct 5;397:122752. doi: 10.1016/j.jhazmat.2020.122752. Epub 2020 Apr 19. J Hazard Mater. 2020. PMID: 32361243
-
Enhanced Ulva prolifera blooms induced by moderate salinity and a multi-variable integrated risk assessment in semi-closed coastal waters.J Environ Manage. 2025 Aug;390:126294. doi: 10.1016/j.jenvman.2025.126294. Epub 2025 Jun 20. J Environ Manage. 2025. PMID: 40543365
-
The expansion of Ulva prolifera O.F. Müller macroalgal blooms in the Yellow Sea, PR China, through asexual reproduction.Mar Pollut Bull. 2016 Mar 15;104(1-2):101-6. doi: 10.1016/j.marpolbul.2016.01.056. Epub 2016 Feb 5. Mar Pollut Bull. 2016. PMID: 26856643
-
Genetic evidence in tracking the origin of Ulva prolifera blooms in the Yellow Sea, China.Harmful Algae. 2018 Sep;78:86-94. doi: 10.1016/j.hal.2018.08.002. Epub 2018 Aug 15. Harmful Algae. 2018. PMID: 30196928 Review.
-
A review of physical, chemical, and biological green tide prevention methods in the Southern Yellow Sea.Mar Pollut Bull. 2022 Jul;180:113772. doi: 10.1016/j.marpolbul.2022.113772. Epub 2022 May 24. Mar Pollut Bull. 2022. PMID: 35623218 Review.
Cited by
-
Comparative proteomic analysis of Ulva prolifera response to high temperature stress.Proteome Sci. 2018 Oct 27;16:17. doi: 10.1186/s12953-018-0145-5. eCollection 2018. Proteome Sci. 2018. PMID: 30386183 Free PMC article.
-
Community Structure of Bacteria Associated With Drifting Sargassum horneri, the Causative Species of Golden Tide in the Yellow Sea.Front Microbiol. 2019 May 28;10:1192. doi: 10.3389/fmicb.2019.01192. eCollection 2019. Front Microbiol. 2019. PMID: 31191503 Free PMC article.
-
A siphonous morphology affects light-harvesting modulation in the intertidal green macroalga Bryopsis corticulans (Ulvophyceae).Planta. 2018 Jun;247(6):1293-1306. doi: 10.1007/s00425-018-2854-5. Epub 2018 Feb 19. Planta. 2018. PMID: 29460179 Free PMC article.
-
A comparative study of the photosynthetic capacity in two green tide macroalgae using chlorophyll fluorescence.Springerplus. 2016 Jun 17;5(1):775. doi: 10.1186/s40064-016-2488-7. eCollection 2016. Springerplus. 2016. PMID: 27386261 Free PMC article.
-
Physiological functional traits explain morphological variation of Ulva prolifera during the drifting of green tides.Ecol Evol. 2022 Jan 17;12(1):e8504. doi: 10.1002/ece3.8504. eCollection 2022 Jan. Ecol Evol. 2022. PMID: 35136557 Free PMC article.
References
-
- Taylor R, Fletcher R, Raven J (2001) Preliminary studies on the growth of selected ‘green tide’ algae in laboratory culture: effects of irradiance, temperature, salinity and nutrients on growth rate. Botanica Marina 44: 327–336.
-
- Blomster J, Baeck S, Fewer D, Kiirikki M, Lehvo A, et al. (2002) Novel morphology in Enteromorpha (Ulvophyceae) forming green tides. American Journal of Botany 89: 1756–1763. - PubMed
-
- Nelson T, Nelson A, Tjoelker M (2003) Seasonal and spatial patterns of “green tides” (ulvoid algal blooms) and related water quality parameters in the coastal water of Washington State, USA. Botanica Marina 46: 263–275.
-
- Hiraoka M, Ohno M, Kawaguchi S, Yoshida G (2004) Crossing test among floating Ulva thalli forming ‘green-tide’ in Japan. Hydrobiologia 512: 239–245.
-
- Merceron M, Antoine V, Auby I, Morand P (2007) In situ growth potential of the subtidal part of green-tide forming Ulva spp. Stocks. Science of the Total Environment 384: 293–305. - PubMed
Publication types
MeSH terms
Substances
LinkOut - more resources
Full Text Sources
