

Transcriptome profiling of the cancer, adjacent non-tumor and distant normal tissues from a colorectal cancer patient by deep sequencing
- PMID: 22905095
- PMCID: PMC3414479
- DOI: 10.1371/journal.pone.0041001
Transcriptome profiling of the cancer, adjacent non-tumor and distant normal tissues from a colorectal cancer patient by deep sequencing
Abstract
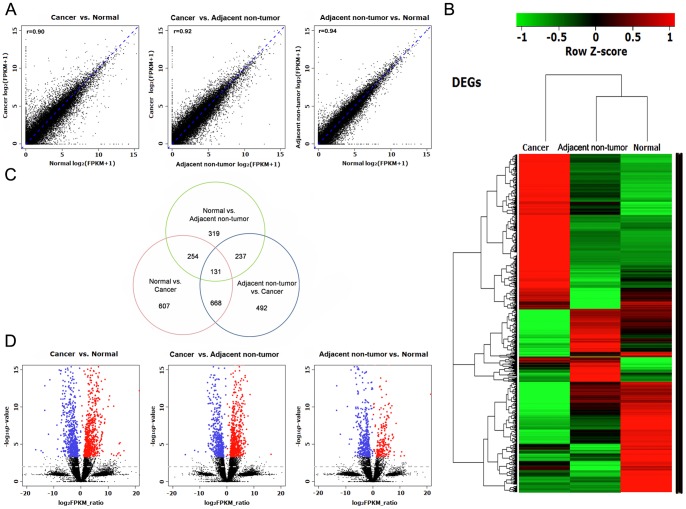
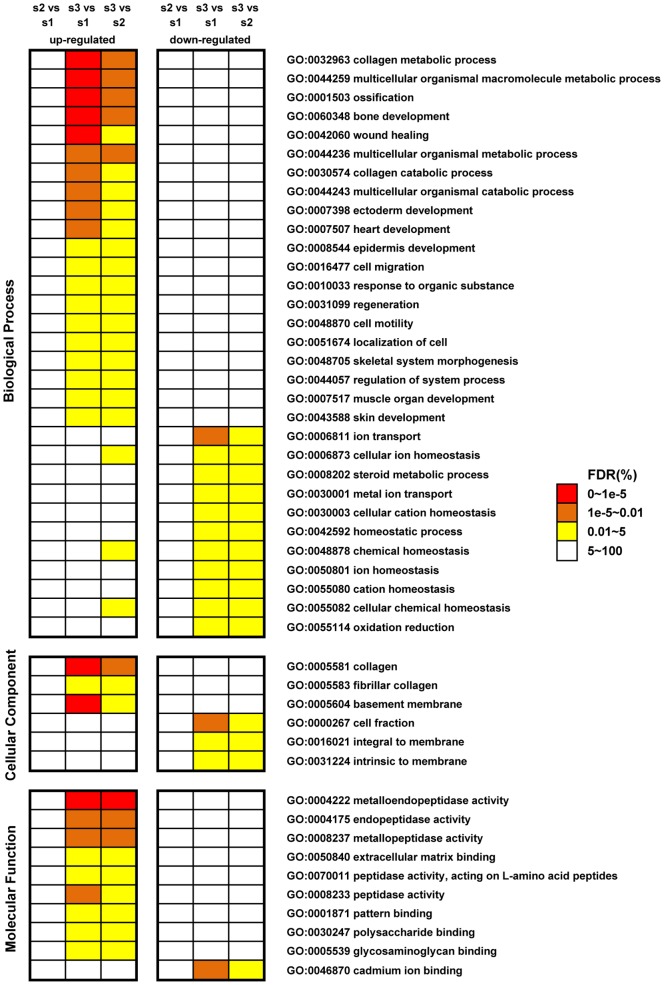
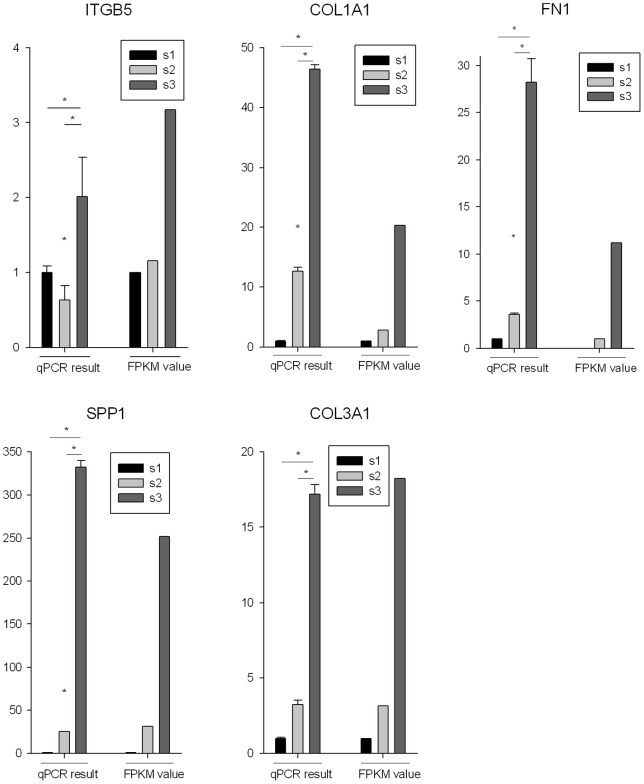
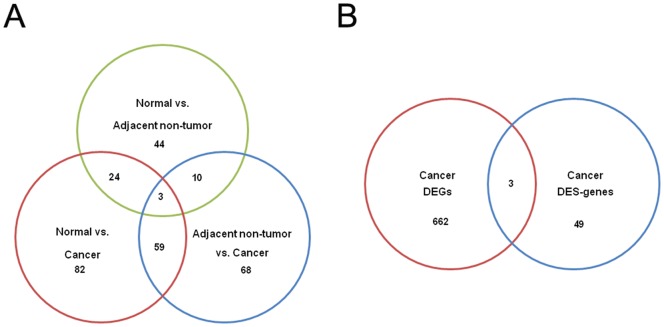
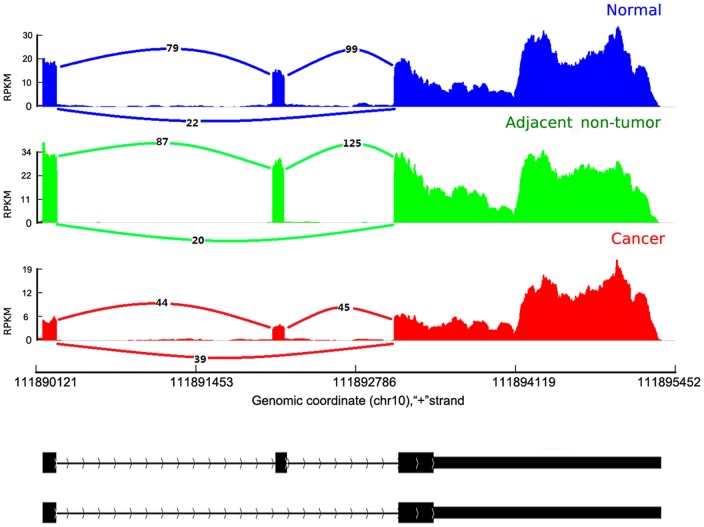
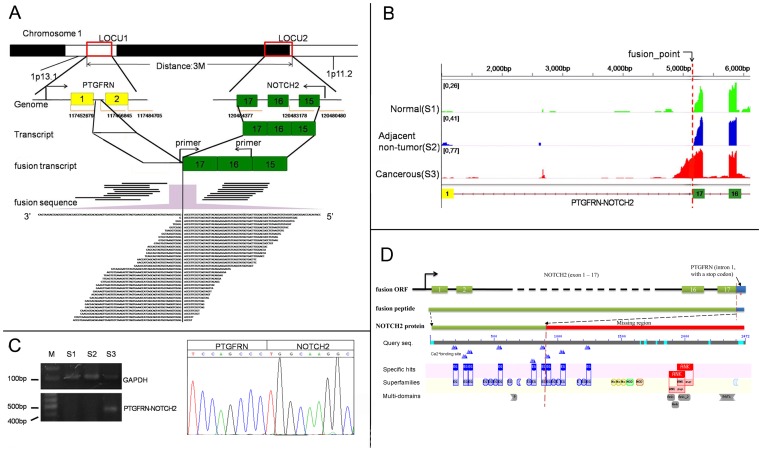
Colorectal cancer (CRC) is one of the most commonly diagnosed cancers in the world. A genome-wide screening of transcriptome dysregulation between cancer and normal tissue would provide insight into the molecular basis of CRC initiation and progression. Compared with microarray technology, which is commonly used to identify transcriptional changes, the recently developed RNA-seq technique has the ability to detect other abnormal regulations in the cancer transcriptome, such as alternative splicing, novel transcripts or gene fusion. In this study, we performed high-throughput transcriptome sequencing at ~50× coverage on CRC, adjacent non-tumor and distant normal tissue. The results revealed cancer-specific, differentially expressed genes and differential alternative splicing, suggesting that the extracellular matrix and metabolic pathways are activated and the genes related to cell homeostasis are suppressed in CRC. In addition, one tumor-restricted gene fusion, PRTEN-NOTCH2, was also detected and experimentally confirmed. This study reveals some common features in tumor invasion and provides a comprehensive survey of the CRC transcriptome, which provides better insight into the complexity of regulatory changes during tumorigenesis.
Conflict of interest statement
Figures
Similar articles
-
Transcriptome profiling of a multiple recurrent muscle-invasive urothelial carcinoma of the bladder by deep sequencing.PLoS One. 2014 Mar 12;9(3):e91466. doi: 10.1371/journal.pone.0091466. eCollection 2014. PLoS One. 2014. PMID: 24622401 Free PMC article.
-
Differential expression of alternatively spliced transcripts related to energy metabolism in colorectal cancer.BMC Genomics. 2016 Dec 28;17(Suppl 14):1011. doi: 10.1186/s12864-016-3351-5. BMC Genomics. 2016. PMID: 28105922 Free PMC article.
-
Transcriptome analysis of paired primary colorectal carcinoma and liver metastases reveals fusion transcripts and similar gene expression profiles in primary carcinoma and liver metastases.BMC Cancer. 2016 Jul 26;16:539. doi: 10.1186/s12885-016-2596-3. BMC Cancer. 2016. PMID: 27461012 Free PMC article.
-
Global impact of RNA splicing on transcriptome remodeling in the heart.J Zhejiang Univ Sci B. 2012 Aug;13(8):603-8. doi: 10.1631/jzus.B1201006. J Zhejiang Univ Sci B. 2012. PMID: 22843179 Free PMC article. Review.
-
Alternative mRNA transcription, processing, and translation: insights from RNA sequencing.Trends Genet. 2015 Mar;31(3):128-39. doi: 10.1016/j.tig.2015.01.001. Epub 2015 Jan 30. Trends Genet. 2015. PMID: 25648499 Review.
Cited by
-
Analysis of the interplay between methylation and expression reveals its potential role in cancer aetiology.Funct Integr Genomics. 2017 Jan;17(1):53-68. doi: 10.1007/s10142-016-0533-9. Epub 2016 Nov 7. Funct Integr Genomics. 2017. PMID: 27819121
-
Integrative analysis of cell adhesion molecules in glioblastoma identified prostaglandin F2 receptor inhibitor (PTGFRN) as an essential gene.BMC Cancer. 2022 Jun 11;22(1):642. doi: 10.1186/s12885-022-09682-2. BMC Cancer. 2022. PMID: 35690717 Free PMC article. Review.
-
Differential Connectivity in Colorectal Cancer Gene Expression Network.Iran Biomed J. 2019 Jan;23(1):34-46. doi: 10.29252/.23.1.34. Epub 2018 May 30. Iran Biomed J. 2019. PMID: 29843204 Free PMC article.
-
Role of COL6A3 in colorectal cancer.Oncol Rep. 2018 Jun;39(6):2527-2536. doi: 10.3892/or.2018.6331. Epub 2018 Mar 23. Oncol Rep. 2018. PMID: 29620224 Free PMC article.
-
Genome-wide analysis of microRNA and mRNA expression signatures in cancer.Acta Pharmacol Sin. 2015 Oct;36(10):1200-11. doi: 10.1038/aps.2015.67. Epub 2015 Aug 24. Acta Pharmacol Sin. 2015. PMID: 26299954 Free PMC article. Review.
References
-
- Jemal A, Siegel R, Ward E, Hao Y, Xu J, et al. (2008) Cancer statistics, 2008. CA Cancer J Clin 58: 71–96. - PubMed
-
- Dukes C (1932) The classification of cancer of the rectum. Journal of Pathological Bacteriology 35: 323.
-
- Markowitz SD, Dawson DM, Willis J, Willson JK (2002) Focus on colon cancer. Cancer Cell 1: 233–236. - PubMed
Publication types
MeSH terms
Substances
Associated data
- Actions
LinkOut - more resources
Full Text Sources
Medical
Molecular Biology Databases
Miscellaneous
