. 2012;7(8):e41710.
doi: 10.1371/journal.pone.0041710. Epub 2012 Aug 8.

Predicting HLA class I non-permissive amino acid residues substitutions

Affiliations

Predicting HLA class I non-permissive amino acid residues substitutions

T Andrew Binkowski et al. PLoS One. 2012.

Abstract

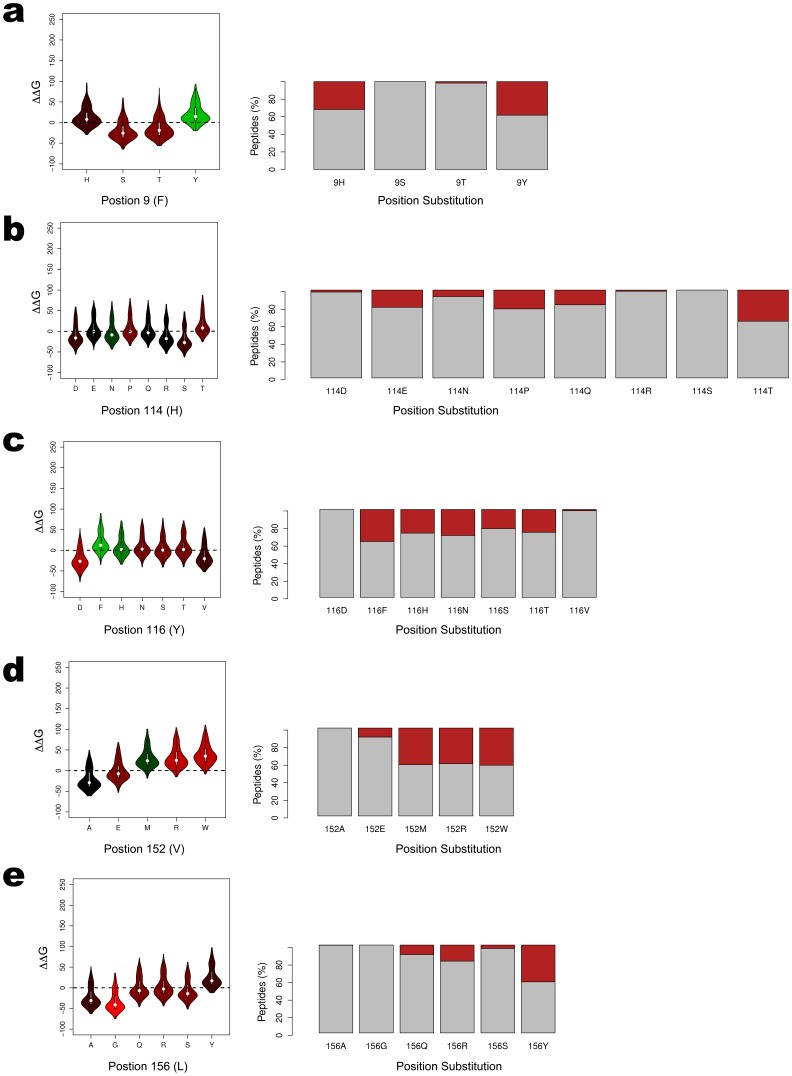
Prediction of peptide binding to human leukocyte antigen (HLA) molecules is essential to a wide range of clinical entities from vaccine design to stem cell transplant compatibility. Here we present a new structure-based methodology that applies robust computational tools to model peptide-HLA (p-HLA) binding interactions. The method leverages the structural conservation observed in p-HLA complexes to significantly reduce the search space and calculate the system's binding free energy. This approach is benchmarked against existing p-HLA complexes and the prediction performance is measured against a library of experimentally validated peptides. The effect on binding activity across a large set of high-affinity peptides is used to investigate amino acid mismatches reported as high-risk factors in hematopoietic stem cell transplantation.


Conflict of interest statement

Competing Interests: The authors have declared that no competing interests exist.

Figures

Figure 1
Figure 1. Structure of the HLA*A2∶01 Molecule.
The structure of the HLA-A*02∶01 (PDB id = 1AKJ) molecule shown with bound peptide backbone (chain C, orange). The positions of the five high-risk residues on the HLA molecule are represented by a blue sphere and labeled. The molecular surface of the molecule is shown in gray.
Figure 2
Figure 2. Conservation of the HLA Peptide Binding Groove.
The structural conservation of the peptide binding groove was measured by performing a superposition of 50 unique p-HLA complexes from the PDB. The pairwise RMSD was calculated between the backbone atoms at each solvent accessible residue comprising the binding groove . The results are summarized as a boxplot showing the median, quartiles, maximum and minimum distances, and outliers (circles) at each residue position. The colors are scaled from green to red (lowest to highest RMSD) with minimum values of 0.28 Å (residue 9) and maximum of 0.83 Å (residue 58). For contrast, the non-binding groove residues are colored black. The average RMSDs are color mapped on to the HLA molecule shown as surface representation (b) and cartoon representation (c) from green (low RMSD) to red (high RMSD).
Figure 3
Figure 3. Variability of Peptides Bound to HLA Molecules.
The structural variability at each residue position for bound nonameric peptides in p-HLA complexes from the PDB. After a structural alignment of the HLA molecules, the peptide coordinates were extracted. The aligned peptides are depicted from the side view (b and d) and top (looking down into the binding groove) view (c and e), both with and without side chains. The backbone-only models are shown in B (side view) and C (top-down view). The alignments with the side chains are shown in D (side view) and E (top-down view). The Cα atoms are shown as black spheres. The pairwise RMSD was calculated between the backbone atoms at each residue position for each peptide. The peptides are colored uniquely and, for reference, the Cα atoms from a peptide (PDB id = 1AKJ, chain = C) are shown as black spheres. The results are summarized as a boxplot showing the median, quartiles, maximum and minimum distances, and outliers (circles) at each residue position.
Figure 4
Figure 4. Peptide Binding Prediction Performance.
The performance of our docking methodology to predict binding peptides is measured using a subset of nearly 6,000 peptides from the IEDB repository of HLA-A*02∶01 epitope binding affinity data. For our approach, the area under the ROC curve is 0.771 (A). The prediction accuracy is measured at varying cutoff thresholds of calculated ΔΔG values (B). The distribution densities of the calculated ΔΔG values for the positive (green) and negative (red) peptides are shown (C).
Figure 5
Figure 5. Effect of High-Risk Amino Acid Substitutions on Binding Predictions.
The distribution of calculated ΔΔG values for each of the 35 structural models from the five non-permissive substitutions are shown as violin plots. The plots are colored according to the Blosum62 amino acid substitution matrix, typically used for scoring evolutionary divergent protein sequences based on local alignment . The colors are scaled according to the matrix’s log odds values, with green representing high frequency substitutions and red representing low frequency substitutions. Each plot highlights the percentage of peptides that are predicted to no longer bind as a result of the substitution in red. Those peptides predicted to retain their binding activity remain in gray.

References

    1. Little AM, Parham P (1999) Polymorphism and evolution of HLA class I and II genes and molecules. Rev Immunogenet 1: 105–123. - PubMed
    1. Shlomchik WD (2007) Graft-versus-host disease. Nat Rev Immunol 7: 340–352. - PubMed
    1. Paczesny S, Hanauer D, Sun Y, Reddy P (2010) New perspectives on the biology of acute GVHD. Bone Marrow Transplant 45: 1–11. - PMC - PubMed
    1. Binkowski TA, Naghibzadeh S, Liang J (2003) CASTp: Computed Atlas of Surface Topography of proteins. Nucleic Acids Res 31: 3352–3355. - PMC - PubMed
    1. Gao GF, Tormo J, Gerth UC, Wyer JR, McMichael AJ, et al. (1997) Crystal structure of the complex between human CD8alpha(alpha) and HLA-A2. Nature 387: 630–634. - PubMed

Publication types