

A mathematical model towards understanding the mechanism of neuronal regulation of wake-NREMS-REMS states
- PMID: 22905114
- PMCID: PMC3414531
- DOI: 10.1371/journal.pone.0042059
A mathematical model towards understanding the mechanism of neuronal regulation of wake-NREMS-REMS states
Abstract
In this study we have constructed a mathematical model of a recently proposed functional model known to be responsible for inducing waking, NREMS and REMS. Simulation studies using this model reproduced sleep-wake patterns as reported in normal animals. The model helps to explain neural mechanism(s) that underlie the transitions between wake, NREMS and REMS as well as how both the homeostatic sleep-drive and the circadian rhythm shape the duration of each of these episodes. In particular, this mathematical model demonstrates and confirms that an underlying mechanism for REMS generation is pre-synaptic inhibition from substantia nigra onto the REM-off terminals that project on REM-on neurons, as has been recently proposed. The importance of orexinergic neurons in stabilizing the wake-sleep cycle is demonstrated by showing how even small changes in inputs to or from those neurons can have a large impact on the ensuing dynamics. The results from this model allow us to make predictions of the neural mechanisms of regulation and patho-physiology of REMS.
Conflict of interest statement
Figures
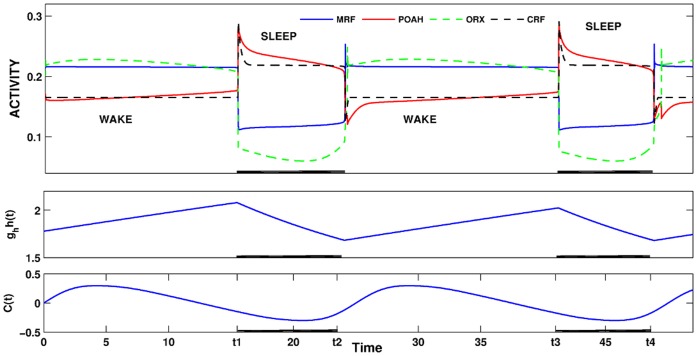
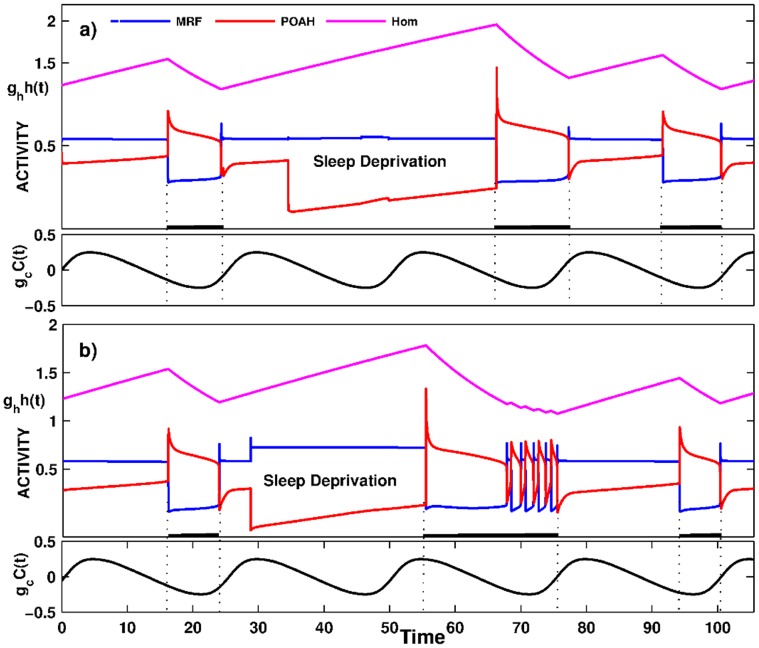
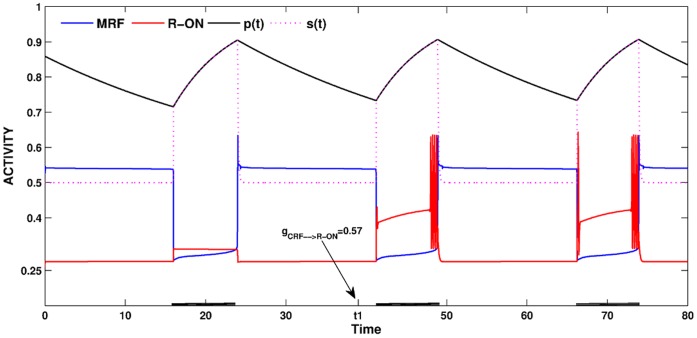
 is increased from 0 to 0.57, resulting in REM bouts in subsequent sleep cycles.
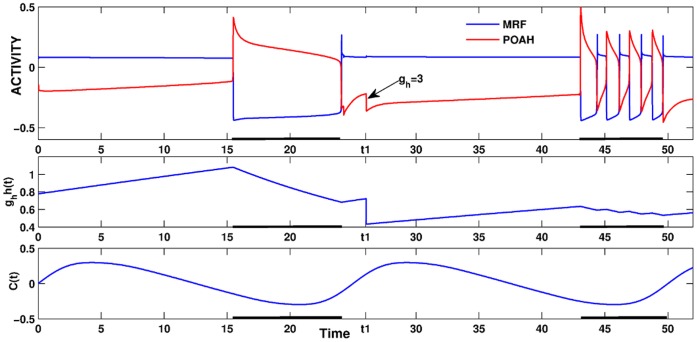

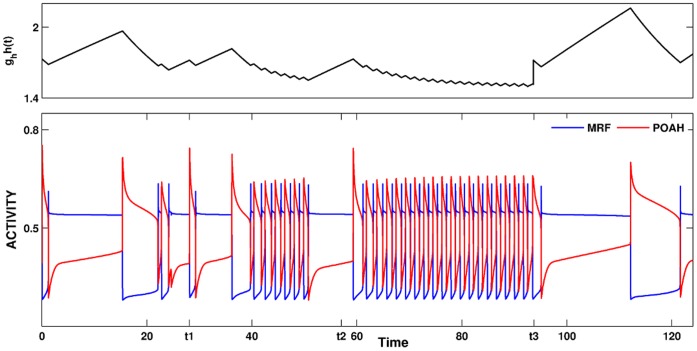
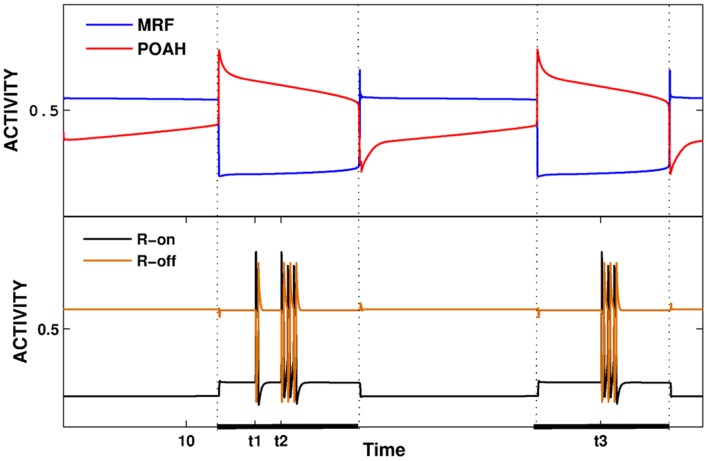
 . This amount of feedback inhibition did not qualitatively change the basic sleep-wake cycling (compare with Fig. 3). At time t1, the feedback inhibition was changed to 0.5. The system was no longer able to stay in a prolonged state of sleep; sleep bouts were continually disrupted by brief awakenings. At time t2,
 was set to 0, which destroyed the cycling. At time t3
 was reset to 0.1 while gh was increased to 7 which restored the normal cycling.
Similar articles
-
A mathematical model of the sleep/wake cycle.J Math Biol. 2010 May;60(5):615-44. doi: 10.1007/s00285-009-0276-5. Epub 2009 Jun 26. J Math Biol. 2010. PMID: 19557415
-
REM sleep modulation by perifornical orexinergic inputs to the pedunculo-pontine tegmental neurons in rats.Neuroscience. 2015 Nov 12;308:125-33. doi: 10.1016/j.neuroscience.2015.09.015. Epub 2015 Sep 8. Neuroscience. 2015. PMID: 26362884
-
Delayed orexin signaling consolidates wakefulness and sleep: physiology and modeling.J Neurophysiol. 2008 Jun;99(6):3090-103. doi: 10.1152/jn.01243.2007. Epub 2008 Apr 16. J Neurophysiol. 2008. PMID: 18417630 Free PMC article.
-
Counterpointing the functional role of the forebrain and of the brainstem in the control of the sleep-waking system.J Sleep Res. 2004 Sep;13(3):179-208. doi: 10.1111/j.1365-2869.2004.00412.x. J Sleep Res. 2004. PMID: 15339255 Review.
-
[Modulation by the hypocretinergic/orexinergic neurotransmission system in sleep-wakefulness cycle states].Rev Neurol. 2007 Oct 16-31;45(8):482-90. Rev Neurol. 2007. PMID: 17948215 Review. Spanish.
Cited by
-
Mammalian rest/activity patterns explained by physiologically based modeling.PLoS Comput Biol. 2013;9(9):e1003213. doi: 10.1371/journal.pcbi.1003213. Epub 2013 Sep 5. PLoS Comput Biol. 2013. PMID: 24039566 Free PMC article.
-
A four-state Markov model of sleep-wakefulness dynamics along light/dark cycle in mice.PLoS One. 2018 Jan 5;13(1):e0189931. doi: 10.1371/journal.pone.0189931. eCollection 2018. PLoS One. 2018. PMID: 29304108 Free PMC article.
-
Development of the sleep-wake switch in rats during the P2-P21 early infancy period.Front Netw Physiol. 2024 Jan 4;3:1340722. doi: 10.3389/fnetp.2023.1340722. eCollection 2023. Front Netw Physiol. 2024. PMID: 38239232 Free PMC article.
-
The Color of Noise and Weak Stationarity at the NREM to REM Sleep Transition in Mild Cognitive Impaired Subjects.Front Psychol. 2018 Jul 17;9:1205. doi: 10.3389/fpsyg.2018.01205. eCollection 2018. Front Psychol. 2018. PMID: 30065684 Free PMC article.
-
Modeling the effect of sleep regulation on a neural mass model.J Comput Neurosci. 2016 Aug;41(1):15-28. doi: 10.1007/s10827-016-0602-z. Epub 2016 Apr 11. J Comput Neurosci. 2016. PMID: 27066796
References
-
- Moruzzi G (1972) The sleep-waking cycle. Ergeb Physiol 64: 1–165. - PubMed
-
- Mallick BN, Inoue S (1999) Rapid Eye Movement Sleep. New York: Marcel Dekker. 419 p.
-
- Mallick BN, Singh A (2011) REM sleep loss increases brain excitability: role of noradrenaline and its mechanism of action. Sleep Med Rev 15: 165–178. - PubMed
-
- Steriade M, McCarley RW (2005) Brain control of wakefulness and sleep. 1st ed. New York: Kluwer Acedemic/Plenum. 728 p..
-
- Mallick BN, Pandi-Perumal SR, McCarley RW, Morrison AR (2011) Rapid Eye Movement Sleep: Regulation and Function. New York: Cambridge. 478 p.
Publication types
MeSH terms
Substances
LinkOut - more resources
Full Text Sources
