. 2012;7(8):e42522.
doi: 10.1371/journal.pone.0042522. Epub 2012 Aug 8.

Nuclear morphometric analysis (NMA): screening of senescence, apoptosis and nuclear irregularities

Affiliations

Nuclear morphometric analysis (NMA): screening of senescence, apoptosis and nuclear irregularities

Eduardo C Filippi-Chiela et al. PLoS One. 2012.

Abstract

Several cellular mechanisms affect nuclear morphology which can therefore be used to assess certain processes. Here, we present an analytic tool to quantify the number of cells in a population that present characteristics of senescence, apoptosis or nuclear irregularities through nuclear morphometric analysis. The tool presented here is based on nuclear image analysis and evaluation of size and regularity of adhered cells in culture. From 46 measurements of nuclear morphometry, principal component analysis filtered four measurements that best separated regular from irregular nuclei. These measurements, namely aspect, area box, radius ratio and roundness were combined into a single nuclear irregularity index (NII). Normal nuclei are used to set the parameters for a given cell type, and different nuclear phenotypes are separated in an area versus NII plot. The tool was validated with β-gal staining for senescence and annexin or caspases inhibitor for apoptosis as well as several treatments that induce different cellular phenotypes. This method provides a direct and objective way of screening normal, senescent, apoptotic and nuclear irregularities which may occur during failed mitosis or mitotic catastrophe, which may be very useful in basic and clinical research.


Conflict of interest statement

Competing Interests: The authors have declared that no competing interests exist.

Figures

Figure 1
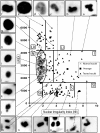
Figure 1. Distribution of nuclei in a plot of area versus NII.
N: Normal nuclei (crosses represent nuclei used to establish the reference population and the ellipse that represents the conjoint distribution for area and NII for normal nuclei); I: irregular, LR: Large Regular; LI: Large Irregular; SR: Small and Regular; S: Small; SI: Small and Irregular. Squares denote the averages of the different populations. Pictures (a–r) show examples of nuclei and their localization in the graph.
Figure 2
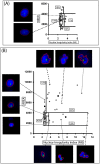
Figure 2. NMA of senescent glioma cells.
C6 glioma cells were treated with DMSO as vehicle control (A) or resveratrol (Rsv) and quercetin (Quer) for 12 days (B) for senescence induction . Light blue diamonds are nuclei from β-galactosidase positive cells. Numbers denote β-gal positive and total nuclei in the different categories and the percentage of nuclei in each category. Inserts show examples of nuclear and β-gal staining (a–g positive and h-j negative).
Figure 3
Figure 3. NMA ofcells treated with vincristine.
U87 cells were treated with DMSO as vehicle control (A) or vincristine 50 nM for 24 h (B). Numbers in boxes denote the percentage of nuclei in each category. Inserts show examples of representative nuclei. Images were obtained directly from IPP6 software (with the boundary marking and the number of nuclei in the photo), to exemplify the marking established by the software. All nuclei are from single cells, as defined by direct visualization.
Figure 4
Figure 4. NMA of cells in apoptosis.
U87 cells were treated with DMSO as vehicle control (A) (two representative overlaid images of nuclei and annexin are shown - both cells are negative for annexin) or Cisplatin (16.6 µM) (B) for 24 h, a well-established protocol of apoptosis induction with three overlaid images of nuclei (blue staining) and annexin (green staining). Green diamonds on the graph represent annexin-positive cells.
Figure 5
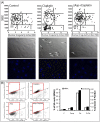
Figure 5. Comparison of NMA and annexin apoptosis quantification.
(A) HeLa cells were pre-treated (1 h) with the caspases inhibitor zAsp-CH2-DCB (100 µM), followed by treatment with Cisplatin (40 µM), DAPI staining and NMA analysis. Top: NMA graphs; Middle: phase contrast; Bottom: DAPI fluorescence. Arrows point to cells with apoptotic phenotype. (B) HeLa cells were treated as in B, followed by annexin V-FITC staining and flow cytometry. Left: Flow cytometry plots. Green Fluorescence: annexin V; Red Fluorescence: PI. Region enclosed in red: Annexin-positive, PI-negative cells (i.e. apoptotic cells). Right: comparative percentage of apoptotic cells measured through NMA or annexin analysis.

References

    1. Vakifahmetoglu H, Olsson M, Zhivotovsky B (2008) Death through a tragedy: mitotic catastrophe. Cell Death Differ 15: 1153–1162. - PubMed
    1. Stevens FE, Beamish H, Warrener R, Gabrielli B (2008) Histone deacetylase inhibitors induce mitotic slippage. Oncogene 27: 1345–1354. - PubMed
    1. Rello-Varona S, Kepp O, Vitale I, Michaud M, Senovilla L, et al. (2010) An automated fluorescence videomicroscopy assay for the detection of mitotic catastrophe. Cell Death Dis 1: e25. - PMC - PubMed
    1. Collado M, Serrano M (2010) Senescence in tumours: evidence from mice and humans. Nat Rev Cancer 10: 51–57. - PMC - PubMed
    1. Zamin LL, Filippi-Chiela EC, Dillenburg-Pilla P, Horn F, Salbego C, et al. (2009) Resveratrol and quercetin cooperate to induce senescence-like growth arrest in C6 rat glioma cells. Cancer Sci 100: 1655–1662. - PMC - PubMed

Publication types