Positive selection on the osteoarthritis-risk and decreased-height associated variants at the GDF5 gene in East Asians
- PMID: 22905146
- PMCID: PMC3419199
- DOI: 10.1371/journal.pone.0042553
Positive selection on the osteoarthritis-risk and decreased-height associated variants at the GDF5 gene in East Asians
Abstract
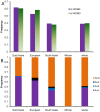
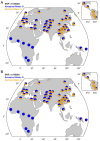
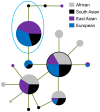
GDF5 is a member of the bone morphogenetic protein (BMP) gene family, and plays an important role in the development of the skeletal system. Variants of the gene are associated with osteoarthritis and height in some human populations. Here, we resequenced the gene in individuals from four geographically separated human populations, and found that the evolution of the promoter region deviated from neutral expectations, with the sequence evolution driven by positive selection in the East Asian population, especially the haplotypes carrying the derived alleles of 5' UTR SNPs rs143384 and rs143383. The derived alleles of rs143384 and rs143383, which are associated with a risk of osteoarthritis and decreased height, have high frequencies in non-Africans and show strong extended haplotype homozygosity and high population differentiation in East Asian. It is concluded that positive selection has driven the rapid evolution of the two osteoarthritis osteoarthritis-risk and decreased height associated variants of the human GDF5 gene, and supports the suggestion that the reduction in body size during the terminal Pleistocene and Holocene period might have been an adaptive process influenced by genetic factors.
Conflict of interest statement
Figures


Similar articles
-
Expression of the osteoarthritis-associated gene GDF5 is modulated epigenetically by DNA methylation.Hum Mol Genet. 2011 Sep 1;20(17):3450-60. doi: 10.1093/hmg/ddr253. Epub 2011 Jun 3. Hum Mol Genet. 2011. PMID: 21642387
-
Common variants in the GDF5-UQCC region are associated with variation in human height.Nat Genet. 2008 Feb;40(2):198-203. doi: 10.1038/ng.74. Epub 2008 Jan 13. Nat Genet. 2008. PMID: 18193045 Free PMC article.
-
A functional polymorphism in the 5' UTR of GDF5 is associated with susceptibility to osteoarthritis.Nat Genet. 2007 Apr;39(4):529-33. doi: 10.1038/2005. Epub 2007 Mar 25. Nat Genet. 2007. PMID: 17384641
-
The association of growth differentiation factor 5 rs143383 gene polymorphism with osteoarthritis: a systematic review and meta-analysis.J Orthop Surg Res. 2023 Oct 10;18(1):763. doi: 10.1186/s13018-023-04245-y. J Orthop Surg Res. 2023. PMID: 37817264 Free PMC article.
-
A comprehensive meta-analysis of association between genetic variants of GDF5 and osteoarthritis of the knee, hip and hand.Inflamm Res. 2015 Jun;64(6):405-14. doi: 10.1007/s00011-015-0818-9. Epub 2015 Apr 17. Inflamm Res. 2015. PMID: 25894512 Review.
Cited by
-
Osteoarthritis year in review 2018: genetics and epigenetics.Osteoarthritis Cartilage. 2019 Mar;27(3):371-377. doi: 10.1016/j.joca.2018.10.004. Epub 2018 Oct 25. Osteoarthritis Cartilage. 2019. PMID: 30808485 Free PMC article. Review.
-
Decreased Risk of Knee Osteoarthritis with Taller Height in an East Asian Population: A Nationwide Cohort Study.J Clin Med. 2023 Dec 23;13(1):92. doi: 10.3390/jcm13010092. J Clin Med. 2023. PMID: 38202099 Free PMC article.
-
Heads, Shoulders, Elbows, Knees, and Toes: Modular Gdf5 Enhancers Control Different Joints in the Vertebrate Skeleton.PLoS Genet. 2016 Nov 30;12(11):e1006454. doi: 10.1371/journal.pgen.1006454. eCollection 2016 Nov. PLoS Genet. 2016. PMID: 27902701 Free PMC article.
-
Antagonistic Pleiotropy in Human Disease.J Mol Evol. 2020 Jan;88(1):12-25. doi: 10.1007/s00239-019-09923-2. Epub 2019 Dec 21. J Mol Evol. 2020. PMID: 31863128 Review.
-
The Myth of Optimality in Clinical Neuroscience.Trends Cogn Sci. 2018 Mar;22(3):241-257. doi: 10.1016/j.tics.2017.12.006. Epub 2018 Feb 20. Trends Cogn Sci. 2018. PMID: 29475637 Free PMC article. Review.
References
-
- Varki A, Altheide TK (2005) Comparing the human and chimpanzee genomes: searching for needles in a haystack. Genome Res 15: 1746–1758. - PubMed
-
- Sabeti PC, Schaffner SF, Fry B, Lohmueller J, Varilly P, et al. (2006) Positive natural selection in the human lineage. Science 312: 1614–1620. - PubMed
-
- Wu DD, Zhang YP (2008) Positive Darwinian selection in human population: A review. Chinese Science Bulletin 53: 1457–1467.
-
- Wu DD, Zhang YP (2010) Positive selection drives population differentiation in the skeletal genes in modern humans. Hum Mol Genet 19: 2341–2346. - PubMed
Publication types
MeSH terms
Substances
LinkOut - more resources
Full Text Sources
Medical

