

Molecular and phylogeographic analysis of human immuno-deficiency virus type 1 strains infecting treatment-naive patients from Kigali, Rwanda
- PMID: 22905148
- PMCID: PMC3419187
- DOI: 10.1371/journal.pone.0042557
Molecular and phylogeographic analysis of human immuno-deficiency virus type 1 strains infecting treatment-naive patients from Kigali, Rwanda
Abstract
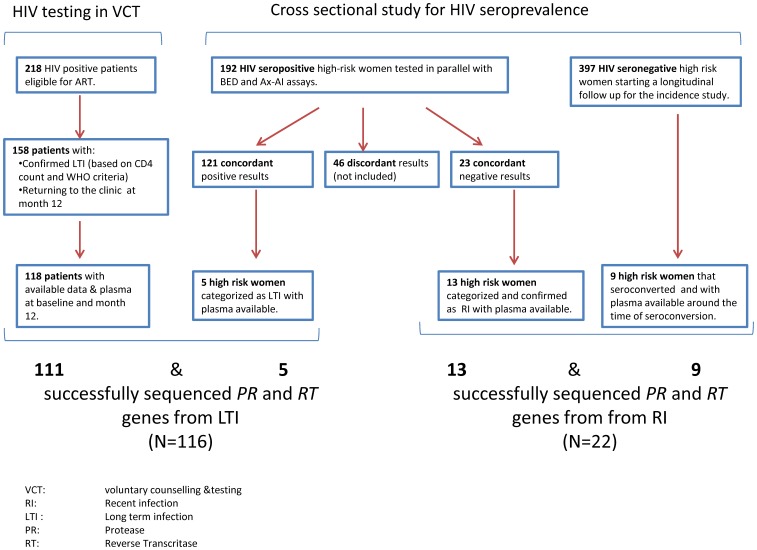
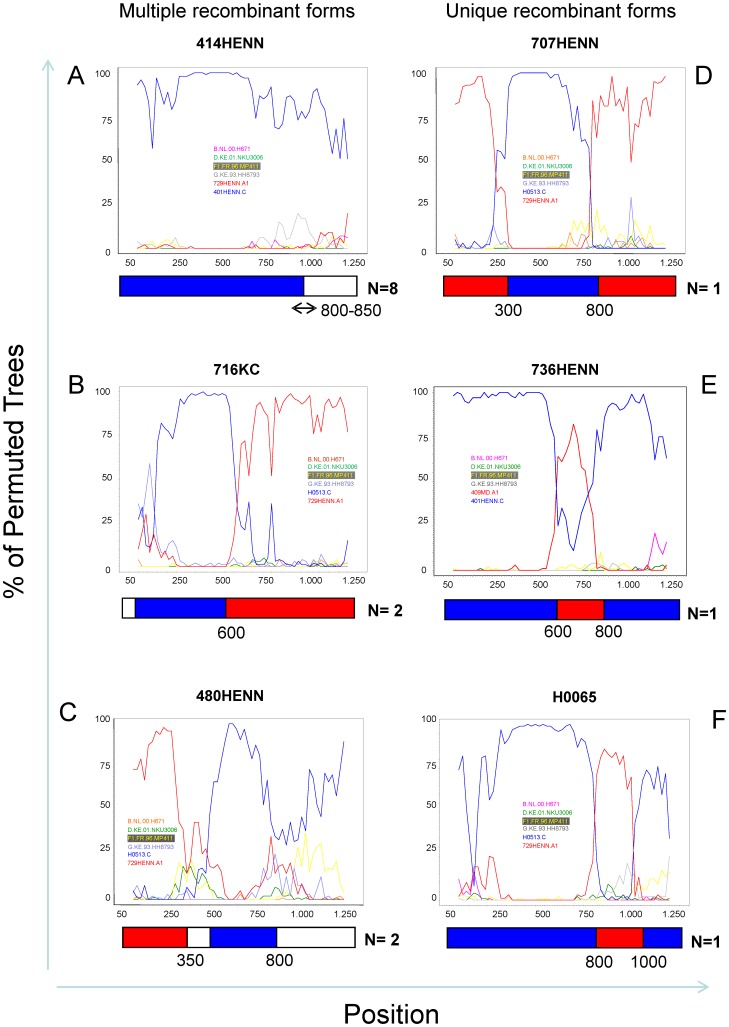
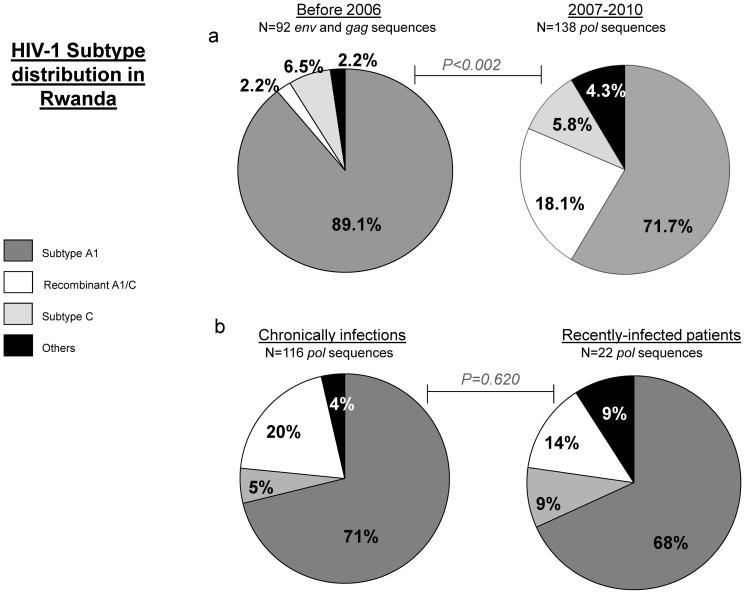
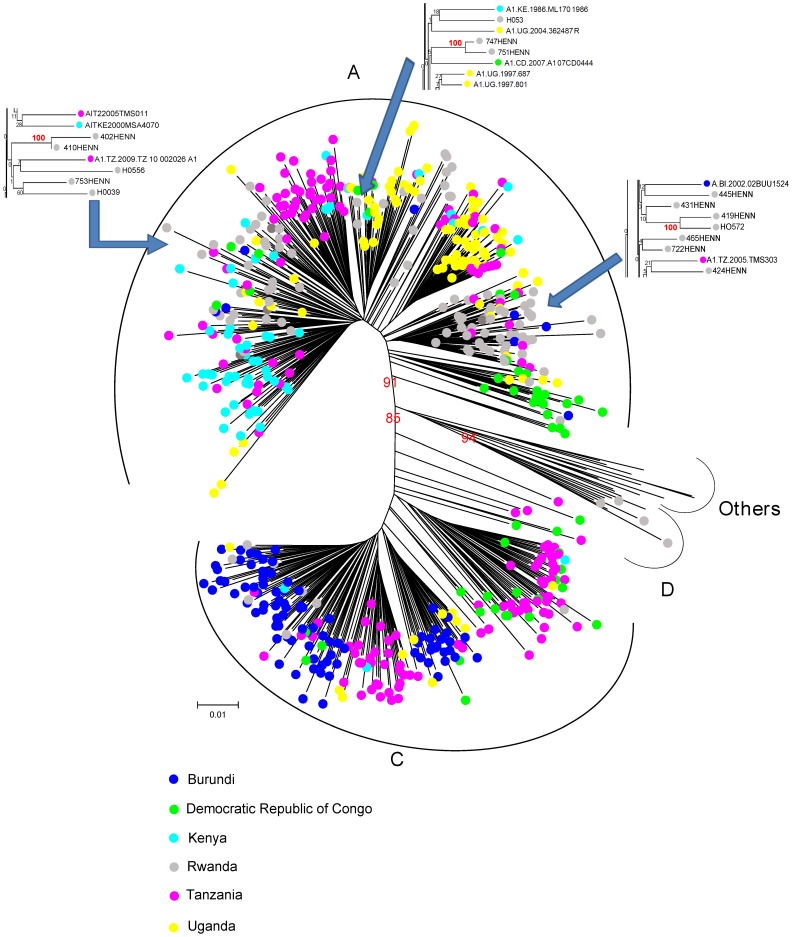
This study aimed at describing the genetic subtype distribution of HIV-1 strains circulating in Kigali and their epidemiological link with the HIV-1 strains from the five countries surrounding Rwanda. One hundred and thirty eight pol (RT and PR) sequences from 116 chronically- and 22 recently-infected antiretroviral therapy (ART)-naïve patients from Kigali were generated and subjected to HIV drug resistance (HIV-DR), phylogenetic and recombinant analyses in connection with 366 reference pol sequences from Rwanda, Burundi, Kenya, Democratic Republic of Congo, Tanzania and Uganda (Los Alamos database). Among the Rwandan samples, subtype A1 predominated (71.7%), followed by A1/C recombinants (18.1%), subtype C (5.8%), subtype D (2.9%), one A1/D recombinant (0.7%) and one unknown subtype (0.7%). Thirteen unique and three multiple A1/C recombinant forms were identified. No evidence for direct transmission events was found within the Rwandan strains. Molecular characteristics of HIV-1 were similar between chronically and recently-infected individuals and were not significantly associated with demographic or social factors. Our report suggests that the HIV-1 epidemic in Kigali is characterized by the emergence of A1/C recombinants and is not phylogenetically connected with the HIV-1 epidemic in the five neighboring countries. The relatively low level of transmitted HIV-DR mutations (2.9%) reported here indicates the good performance of the ART programme in Rwanda. However, the importance of promoting couples' counseling, testing and disclosure during HIV prevention strategies is highlighted.
Conflict of interest statement
Figures
Similar articles
-
HIV-1 pol diversity among female bar and hotel workers in Northern Tanzania.PLoS One. 2014 Jul 8;9(7):e102258. doi: 10.1371/journal.pone.0102258. eCollection 2014. PLoS One. 2014. PMID: 25003939 Free PMC article.
-
Identification of new, emerging HIV-1 unique recombinant forms and drug resistant viruses circulating in Cameroon.Virol J. 2011 Apr 23;8:185. doi: 10.1186/1743-422X-8-185. Virol J. 2011. PMID: 21513545 Free PMC article.
-
HIV type 1 pol gene diversity and archived nevirapine resistance mutation in pregnant women in Rwanda.AIDS Res Hum Retroviruses. 2004 Mar;20(3):279-83. doi: 10.1089/088922204322996518. AIDS Res Hum Retroviruses. 2004. PMID: 15117451
-
Prevalence of transmitted HIV-1 drug resistance among young adults attending HIV counselling and testing clinics in Kigali, Rwanda.Antivir Ther. 2016;21(3):247-51. doi: 10.3851/IMP2999. Epub 2015 Oct 12. Antivir Ther. 2016. PMID: 26458150
-
Characterization of drug resistance mutations in naïve and ART-treated patients infected with HIV-1 in Yaounde, Cameroon.J Med Virol. 2012 May;84(5):721-7. doi: 10.1002/jmv.23244. J Med Virol. 2012. PMID: 22431019
Cited by
-
Transmission and Drug Resistance Characteristics of Human Immunodeficiency Virus-1 Strain Using Medical Information Data Retrieval System.Comput Math Methods Med. 2022 Jun 13;2022:2173339. doi: 10.1155/2022/2173339. eCollection 2022. Comput Math Methods Med. 2022. PMID: 35734773 Free PMC article.
-
Deciphering the complex distribution of human immunodeficiency virus type 1 subtypes among different cohorts in Northern Tanzania.PLoS One. 2013 Dec 11;8(12):e81848. doi: 10.1371/journal.pone.0081848. eCollection 2013. PLoS One. 2013. PMID: 24349139 Free PMC article.
-
HIV-1 subtypes and drug resistance mutations among female sex workers varied in different cities and regions of the Democratic Republic of Congo.PLoS One. 2020 Feb 11;15(2):e0228670. doi: 10.1371/journal.pone.0228670. eCollection 2020. PLoS One. 2020. PMID: 32045455 Free PMC article.
-
Worldwide Genetic Features of HIV-1 Env α4β7 Binding Motif: The Local Dissemination Impact of the LDI Tripeptide.J Acquir Immune Defic Syndr. 2015 Dec 15;70(5):463-71. doi: 10.1097/QAI.0000000000000802. J Acquir Immune Defic Syndr. 2015. PMID: 26569174 Free PMC article.
-
HIV-1 pol diversity among female bar and hotel workers in Northern Tanzania.PLoS One. 2014 Jul 8;9(7):e102258. doi: 10.1371/journal.pone.0102258. eCollection 2014. PLoS One. 2014. PMID: 25003939 Free PMC article.
References
-
- Ministry of finance and economic planning, national census service (2003) 3rd general census of population and housing of Rwanda-August 2002.
-
- Van de Perre P, Rouvroy D, Lepage P, Bogaerts J, Kestelyn P, et al. (1984) Acquired immunodeficiency syndrome in Rwanda. Lancet 2: 62–5. - PubMed
-
- Bujingo G, Ntilivamunda A, Nzaramba D, Van de Perre A, Ndikuyeze, et al. (1988) Etude sur la séropositivité liée à l'infection au virus de l'immunodéficience humaine au Rwanda. Revue Médicale Rwandaise 20: 37–42.
-
- Rwanda HIV prevalence study group (1989) Nationwide community-based serological survey of HIV-1 and other human retrovirus infections in a central African country. Lancet i941–3. - PubMed
Publication types
MeSH terms
Substances
LinkOut - more resources
Full Text Sources
Medical
Research Materials
