. 2012;7(8):e43052.
doi: 10.1371/journal.pone.0043052. Epub 2012 Aug 15.

Analysis of the gut microbiota in the old order Amish and its relation to the metabolic syndrome

Affiliations

Analysis of the gut microbiota in the old order Amish and its relation to the metabolic syndrome

Margaret L Zupancic et al. PLoS One. 2012.

Abstract

Obesity has been linked to the human gut microbiota; however, the contribution of gut bacterial species to the obese phenotype remains controversial because of conflicting results from studies in different populations. To explore the possible dysbiosis of gut microbiota in obesity and its metabolic complications, we studied men and women over a range of body mass indices from the Old Order Amish sect, a culturally homogeneous Caucasian population of Central European ancestry. We characterized the gut microbiota in 310 subjects by deep pyrosequencing of bar-coded PCR amplicons from the V1-V3 region of the 16S rRNA gene. Three communities of interacting bacteria were identified in the gut microbiota, analogous to previously identified gut enterotypes. Neither BMI nor any metabolic syndrome trait was associated with a particular gut community. Network analysis identified twenty-two bacterial species and four OTUs that were either positively or inversely correlated with metabolic syndrome traits, suggesting that certain members of the gut microbiota may play a role in these metabolic derangements.


Conflict of interest statement

Competing Interests: The authors have declared that no competing interests exist.

Figures

Figure 1
Figure 1. Bacterial networks in the human gut microbiota.
Bacterial networks were identified based on statistically significant correlations among genera using the Louvain algorithm. Network I: Prevotella-dominated (A), Network II: Bacteroides-dominated (B) and Network III: Oscillospira-dominated (C) are illustrated, where the dominant bacterial genus is highlighted in yellow and other genera in green. The size of the circles represents the mean relative abundance of each genus in the OOA population. Solid lines represent positive correlations and dashed lines represent inverse correlations (all p<0.001). Numbers connecting microbes are the correlation coefficient. (D) Diversity in the three networks as measured by the Shannon Diversity metric.
Figure 2
Figure 2. UniFrac Principle Co-Ordinates Analysis plot, showing each study sample positioned according to its first two principle coordinates.
These are determined by the classical multidimensional scaling algorithm so that the Euclidean distance between points approximates the unweighted UniFrac distance between the OTU profiles of the corresponding samples, colored by Abundance of (A) Prevotella, (B) Bacteroides, and (C) Firmicutes.
Figure 3
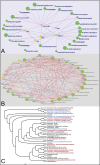
Figure 3. Bacterial species and OTUs correlated with metabolic syndrome phenotype.
(A) Known species and Operational Taxonomic Units (OTUs) (green circles) linked to metabolic syndrome traits (yellow diamonds), illustrating statistically significant correlation coefficients using the Louvain algorithm. The size of the circles represents the mean relative abundance in the Amish cohort studied. Numbers connecting microbes are the correlation coefficient (p<0.001 for all). Solid lines represent positive correlations and dashed lines represent inverse correlations. (B) The same network as shown in panel A, but also including the statistically significant associations between bacterial taxa. (C) Phylogenetic tree of 16S rRNA sequences from the bacterial taxa in this network using the R implementation of DNADIST and FASTME. OTUs and known species that are inversely correlated with metabolic syndrome traits are colored in red and that are positively correlated with metabolic syndrome traits are colored in blue (p<0.001 for all).

References

    1. Mokdad AH, Marks JS, Stroup DF, Gerberding JL (2004) Actual causes of death in the United States. JAMA 291: 238–1245. - PubMed
    1. Power ML, Schulkin J (2008) Sex differences in fat storage, fat metabolism, and the health risks from obesity: possible evolutionary origins. Br. J. Nutrition 99: 931–940. - PubMed
    1. Hotamisligil GS (2010) Endoplasmic reticulum stress and the inflammatory basis of metabolic disease. Cell 140: 900–17. - PMC - PubMed
    1. Ley RE, Backhed F, Turnbaugh P, Lozupone CA, Knight RD, et al. (2005) Obesity alters gut microbial ecology. Proc. Natl. Acad. Sci. USA 102: 11070–11075. - PMC - PubMed
    1. Turnbaugh PJ, Ley RE, Mahowald MA, Magrini V, Mardis ER, et al. (2006) An obesity-associated gut microbiome with increased capacity for energy harvest. Nature 444: 1027–1031 (2006).. - PubMed

Publication types

Substances