

The structural stability of the endothelial glycocalyx after enzymatic removal of glycosaminoglycans
- PMID: 22905223
- PMCID: PMC3419189
- DOI: 10.1371/journal.pone.0043168
The structural stability of the endothelial glycocalyx after enzymatic removal of glycosaminoglycans
Abstract
Rationale: It is widely believed that glycosaminoglycans (GAGs) and bound plasma proteins form an interconnected gel-like structure on the surface of endothelial cells (the endothelial glycocalyx layer-EGL) that is stabilized by the interaction of its components. However, the structural organization of GAGs and proteins and the contribution of individual components to the stability of the EGL are largely unknown.
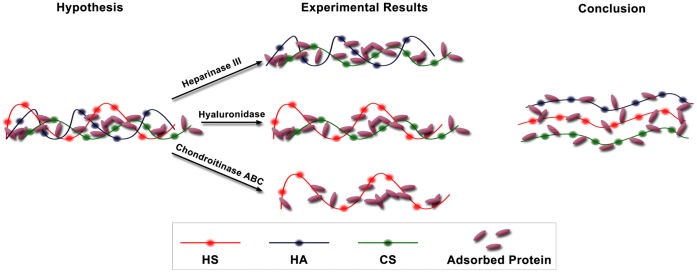
Objective: To evaluate the hypothesis that the interconnected gel-like glycocalyx would collapse when individual GAG components were almost completely removed by a specific enzyme.
Methods and results: Using confocal microscopy, we observed that the coverage and thickness of heparan sulfate (HS), chondroitin sulfate (CS), hyaluronic acid (HA), and adsorbed albumin were similar, and that the thicknesses of individual GAGs were spatially nonuniform. The individual GAGs were degraded by specific enzymes in a dose-dependent manner, and decreased much more in coverage than in thickness. Removal of HS or HA did not result in cleavage or collapse of any of the remaining components. Simultaneous removal of CS and HA by chondroitinase did not affect HS, but did reduce adsorbed albumin, although the effect was not large.
Conclusion: All GAGs and adsorbed proteins are well inter-mixed within the structure of the EGL, but the GAG components do not interact with one another. The GAG components do provide binding sites for albumin. Our results provide a new view of the organization of the endothelial glycocalyx layer and provide the first demonstration of the interaction between individual GAG components.
Conflict of interest statement
Figures

 ) and the width of the region’s bounding box (ΔL). The total area and length of all regions represent the area (
 ) and the length (L), respectively, of the ROI (
 ;
; ). The average thickness (
 ) in this slice is 2.23 µm. (K–L) Partial enlargement of the XZ-slice image with a junctional thickness measure line. The half-maximum intensity value was employed as the 2nd threshold for junctional thickness detection. In this image, the signal-to-noise ratio is 9.11, and the junction thickness of HS is 3.00 µm.


Similar articles
-
Composition of the endothelial glycocalyx and its relation to its thickness and diffusion of small solutes.Microvasc Res. 2010 Dec;80(3):394-401. doi: 10.1016/j.mvr.2010.06.005. Epub 2010 Jun 21. Microvasc Res. 2010. PMID: 20600162 Free PMC article.
-
RNA Contaminates Glycosaminoglycans Extracted from Cells and Tissues.PLoS One. 2016 Nov 29;11(11):e0167336. doi: 10.1371/journal.pone.0167336. eCollection 2016. PLoS One. 2016. PMID: 27898729 Free PMC article.
-
Effect of high glucose on glycosaminoglycans in cultured retinal endothelial cells and rat retina.Glycobiology. 2022 Jul 13;32(8):720-734. doi: 10.1093/glycob/cwac029. Glycobiology. 2022. PMID: 35552402 Free PMC article.
-
A biological guide to glycosaminoglycans: current perspectives and pending questions.FEBS J. 2024 Aug;291(15):3331-3366. doi: 10.1111/febs.17107. Epub 2024 Mar 18. FEBS J. 2024. PMID: 38500384 Review.
-
Investigation of Endothelial Surface Glycocalyx Components and Ultrastructure by Single Molecule Localization Microscopy: Stochastic Optical Reconstruction Microscopy (STORM).Yale J Biol Med. 2018 Sep 21;91(3):257-266. eCollection 2018 Sep. Yale J Biol Med. 2018. PMID: 30258313 Free PMC article. Review.
Cited by
-
Presegmentation Procedure Generates Smooth-Sided Microfluidic Devices: Unlocking Multiangle Imaging for Everyone?ACS Omega. 2019 Dec 2;4(25):20972-20977. doi: 10.1021/acsomega.9b02139. eCollection 2019 Dec 17. ACS Omega. 2019. PMID: 31867488 Free PMC article.
-
Cancer cell glycocalyx mediates mechanotransduction and flow-regulated invasion.Integr Biol (Camb). 2013 Nov;5(11):1334-43. doi: 10.1039/c3ib40057c. Epub 2013 Sep 30. Integr Biol (Camb). 2013. PMID: 24077103 Free PMC article.
-
Heparan sulfate proteoglycan glypican-1 and PECAM-1 cooperate in shear-induced endothelial nitric oxide production.Sci Rep. 2021 May 31;11(1):11386. doi: 10.1038/s41598-021-90941-w. Sci Rep. 2021. PMID: 34059731 Free PMC article.
-
Effect of combined chondroitinase ABC and hyperbaric oxygen therapy in a rat model of spinal cord injury.Mol Med Rep. 2018 Jul;18(1):25-30. doi: 10.3892/mmr.2018.8933. Epub 2018 Apr 26. Mol Med Rep. 2018. PMID: 29749479 Free PMC article.
-
Endothelial Glycocalyx Layer Properties and Its Ability to Limit Leukocyte Adhesion.Biophys J. 2020 Apr 7;118(7):1564-1575. doi: 10.1016/j.bpj.2020.02.010. Epub 2020 Feb 15. Biophys J. 2020. PMID: 32135082 Free PMC article.
References
-
- Pries AR, Secomb TW, Gaehtgens P (2000) The endothelial surface layer. Pflugers Arch 440: 653–666. - PubMed
-
- Tarbell JM, Ebong EE (2008) The endothelial glycocalyx: a mechano-sensor and-transducer. Sci Signal 1: pt8. - PubMed
-
- Weinbaum S, Tarbell JM, Damiano ER (2007) The structure and function of the endothelial glycocalyx layer. Annu Rev Biomed Eng 9: 121–167. - PubMed
Publication types
MeSH terms
Substances
Grants and funding
LinkOut - more resources
Full Text Sources
