

Regulation of mariner transposition: the peculiar case of Mos1
- PMID: 22905263
- PMCID: PMC3419177
- DOI: 10.1371/journal.pone.0043365
Regulation of mariner transposition: the peculiar case of Mos1
Abstract
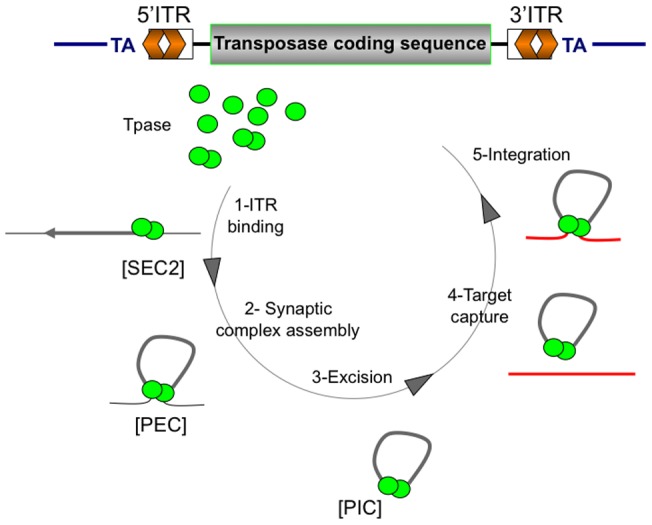
Background: Mariner elements represent the most successful family of autonomous DNA transposons, being present in various plant and animal genomes, including humans. The introduction and co-evolution of mariners within host genomes imply a strict regulation of the transposon activity. Biochemical data accumulated during the past decade have led to a convergent picture of the transposition cycle of mariner elements, suggesting that mariner transposition does not rely on host-specific factors. This model does not account for differences of transposition efficiency in human cells between mariners. We thus wondered whether apparent similarities in transposition cycle could hide differences in the intrinsic parameters that control mariner transposition.
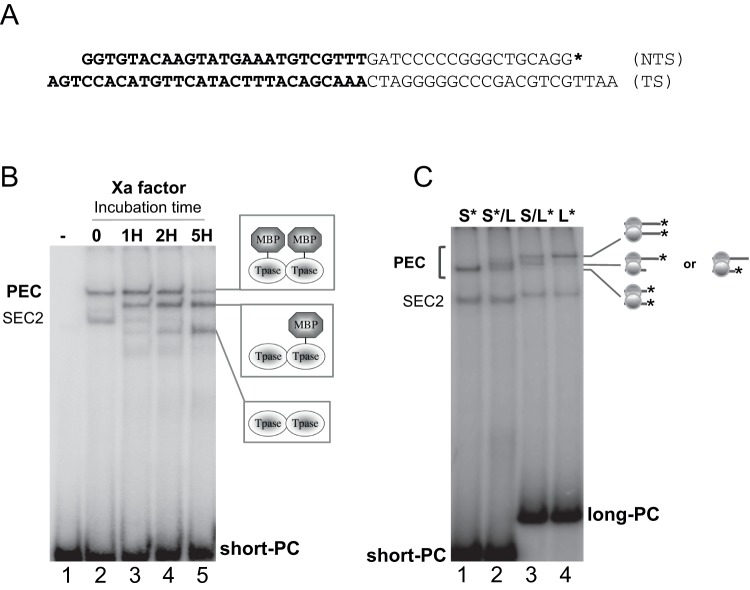
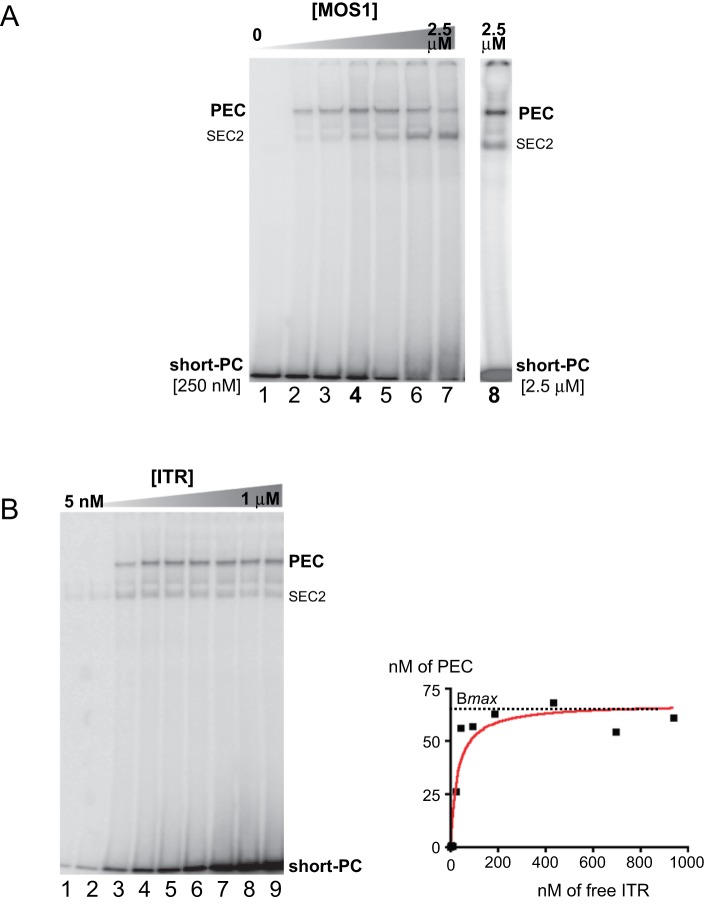
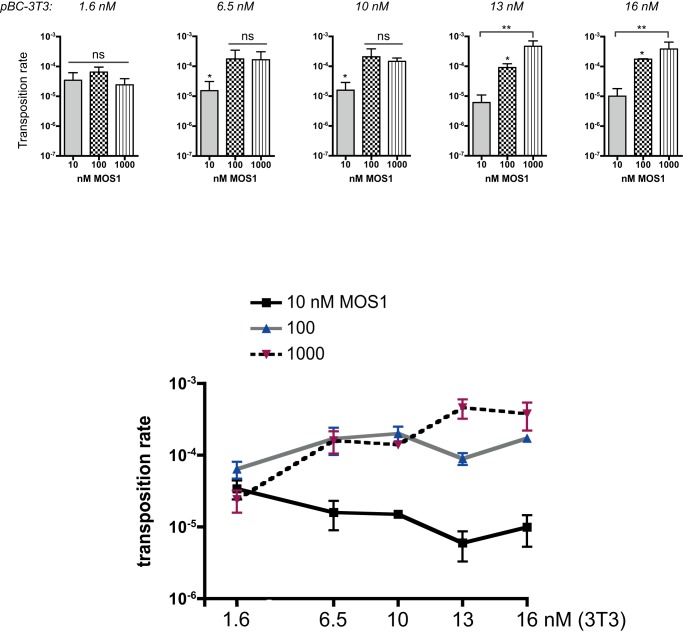
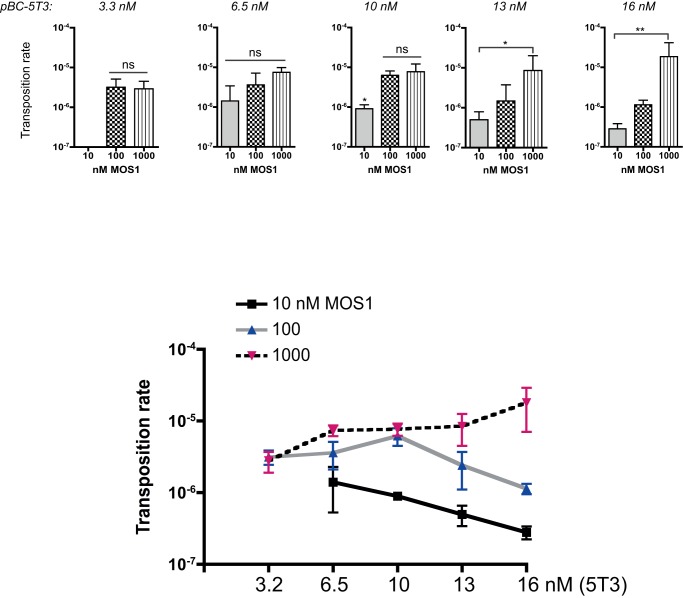
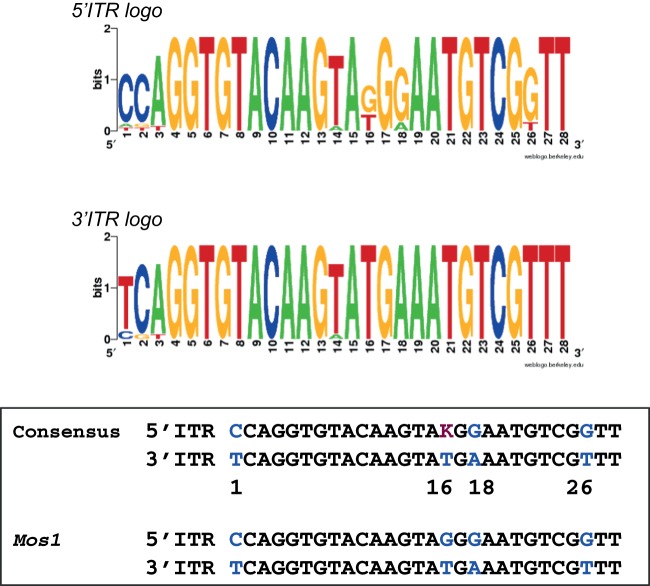
Principal findings: We find that Mos1 transposase concentrations in excess to the Mos1 ends prevent the paired-end complex assembly. However, we observe that Mos1 transposition is not impaired by transposase high concentration, dismissing the idea that transposase over production plays an obligatory role in the down-regulation of mariner transposition. Our main finding is that the paired-end complex is formed in a cooperative way, regardless of the transposase concentration. We also show that an element framed by two identical ITRs (Inverted Terminal Repeats) is more efficient in driving transposition than an element framed by two different ITRs (i.e. the natural Mos1 copy), the latter being more sensitive to transposase concentration variations. Finally, we show that the current Mos1 ITRs correspond to the ancestral ones.
Conclusions: We provide new insights on intrinsic properties supporting the self-regulation of the Mos1 element. These properties (transposase specific activity, aggregation, ITR sequences, transposase concentration/transposon copy number ratio...) could have played a role in the dynamics of host-genomes invasion by Mos1, accounting (at least in part) for the current low copy number of Mos1 within host genomes.
Conflict of interest statement
Figures
Similar articles
-
cis and trans factors affecting Mos1 mariner evolution and transposition in vitro, and its potential for functional genomics.Nucleic Acids Res. 2000 Feb 1;28(3):784-90. doi: 10.1093/nar/28.3.784. Nucleic Acids Res. 2000. PMID: 10637331 Free PMC article.
-
Physical properties of DNA components affecting the transposition efficiency of the mariner Mos1 element.Mol Genet Genomics. 2009 Nov;282(5):531-46. doi: 10.1007/s00438-009-0484-0. Epub 2009 Sep 23. Mol Genet Genomics. 2009. PMID: 19774400
-
Structural Basis for the Inverted Repeat Preferences of mariner Transposases.J Biol Chem. 2015 May 22;290(21):13531-40. doi: 10.1074/jbc.M115.636704. Epub 2015 Apr 13. J Biol Chem. 2015. PMID: 25869132 Free PMC article.
-
Assembly of the Tc1 and mariner transposition initiation complexes depends on the origins of their transposase DNA binding domains.Genetica. 2007 Jun;130(2):105-20. doi: 10.1007/s10709-006-0025-2. Epub 2006 Aug 16. Genetica. 2007. PMID: 16912840 Review.
-
Transposase concentration controls transposition activity: myth or reality?Gene. 2013 Nov 10;530(2):165-71. doi: 10.1016/j.gene.2013.08.039. Epub 2013 Aug 28. Gene. 2013. PMID: 23994686 Review.
Cited by
-
cAMP protein kinase phosphorylates the Mos1 transposase and regulates its activity: evidences from mass spectrometry and biochemical analyses.Nucleic Acids Res. 2014 Jan;42(2):1117-28. doi: 10.1093/nar/gkt874. Epub 2013 Sep 29. Nucleic Acids Res. 2014. PMID: 24081583 Free PMC article.
-
Tools for gene-regulatory analyses in the marine annelid Platynereis dumerilii.PLoS One. 2014 Apr 8;9(4):e93076. doi: 10.1371/journal.pone.0093076. eCollection 2014. PLoS One. 2014. PMID: 24714200 Free PMC article.
-
DNA transposon-based gene vehicles - scenes from an evolutionary drive.J Biomed Sci. 2013 Dec 9;20(1):92. doi: 10.1186/1423-0127-20-92. J Biomed Sci. 2013. PMID: 24320156 Free PMC article. Review.
-
Target capture during Mos1 transposition.J Biol Chem. 2014 Jan 3;289(1):100-11. doi: 10.1074/jbc.M113.523894. Epub 2013 Nov 22. J Biol Chem. 2014. PMID: 24269942 Free PMC article.
-
Natural stilbenoids isolated from grapevine exhibiting inhibitory effects against HIV-1 integrase and eukaryote MOS1 transposase in vitro activities.PLoS One. 2013 Nov 28;8(11):e81184. doi: 10.1371/journal.pone.0081184. eCollection 2013. PLoS One. 2013. PMID: 24312275 Free PMC article.
References
-
- Kazazian HH (2004) Mobile Elements: Drivers of Genome Evolution. Science 303: 1626–1632 doi:10.1126/science.1089670. - PubMed
-
- Rouault J-D, Casse N, Chénais B, Hua-Van A, Filée J, et al. (2009) Automatic classification within families of transposable elements: application to the mariner Family. Gene 448: 227–232 doi:10.1016/j.gene.2009.08.009. - PubMed
-
- Lampe DJ, Witherspoon DJ, Soto-Adames FN, Robertson HM (2003) Recent horizontal transfer of mellifera subfamily mariner transposons into insect lineages representing four different orders shows that selection acts only during horizontal transfer. Mol Biol Evol 20: 554–562 doi:10.1093/molbev/msg069. - PubMed
-
- Hartl DL, Lozovskaya ER, Nurminsky DI, Lohe AR (1997) What restricts the activity of mariner-like transposable elements. Trends Genet 13: 197–201. - PubMed
-
- Robertson HM, Lampe DJ (1995) Recent horizontal transfer of a mariner transposable element among and between Diptera and Neuroptera. Mol Biol Evol 12: 850–862. - PubMed
Publication types
MeSH terms
Substances
LinkOut - more resources
Full Text Sources
Miscellaneous
