

Tea and coffee consumption in relation to vitamin D and calcium levels in Saudi adolescents
- PMID: 22905922
- PMCID: PMC3478213
- DOI: 10.1186/1475-2891-11-56
Tea and coffee consumption in relation to vitamin D and calcium levels in Saudi adolescents
Abstract
Background: Coffee and tea consumption was hypothesized to interact with variants of vitamin D-receptor polymorphisms, but limited evidence exists. Here we determine for the first time whether increased coffee and tea consumption affects circulating levels of 25-hydroxyvitamin D in a cohort of Saudi adolescents.
Methods: A total of 330 randomly selected Saudi adolescents were included. Anthropometrics were recorded and fasting blood samples were analyzed for routine analysis of fasting glucose, lipid levels, calcium, albumin and phosphorous. Frequency of coffee and tea intake was noted. 25-hydroxyvitamin D levels were measured using enzyme-linked immunosorbent assays.
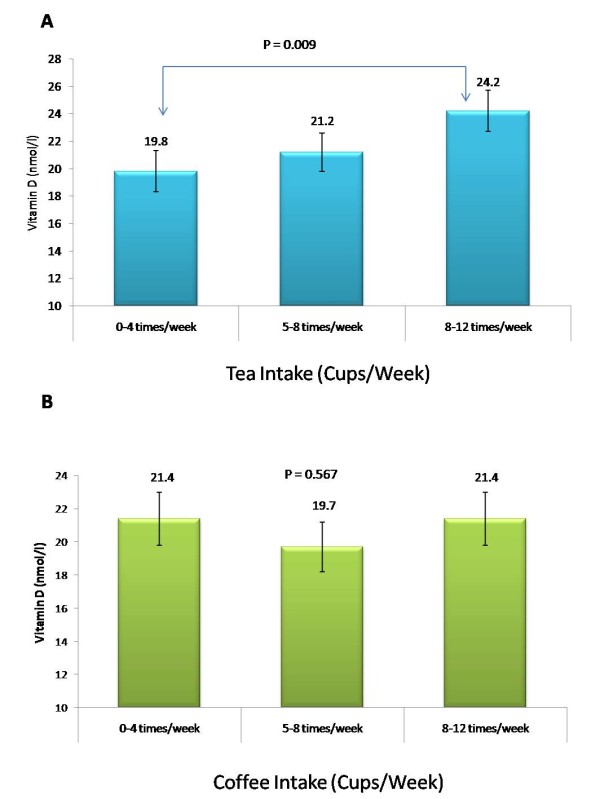
Results: Improved lipid profiles were observed in both boys and girls, as demonstrated by increased levels of HDL-cholesterol, even after controlling for age and BMI, among those consuming 9-12 cups of coffee/week. Vitamin D levels were significantly highest among those consuming 9-12 cups of tea/week in all subjects (p-value 0.009) independent of age, gender, BMI, physical activity and sun exposure.
Conclusion: This study suggests a link between tea consumption and vitamin D levels in a cohort of Saudi adolescents, independent of age, BMI, gender, physical activity and sun exposure. These findings should be confirmed prospectively.
Figures
References
-
- Food and Agricultural Organization. Food balance sheets. http://www.fao.org.
-
- Spiller MA. Caffeine. Boca Raton: CRC Press; 1998. The chemical components of coffee; pp. 97–161.
-
- HealthCanada. Fact Sheet Caffeine and Your Health. 2003. http://www.hc-sc.gc.ca/foodaliment/dg/ecaffeine.html.
MeSH terms
Substances
LinkOut - more resources
Full Text Sources
Medical
