Comparative Study
. 2012 Aug 20:12:679.
doi: 10.1186/1471-2458-12-679.

Controlling epidemic spread by social distancing: do it well or not at all

Affiliations
Comparative Study

Controlling epidemic spread by social distancing: do it well or not at all

Savi Maharaj et al. BMC Public Health. .

Abstract

Background: Existing epidemiological models have largely tended to neglect the impact of individual behaviour on the dynamics of diseases. However, awareness of the presence of illness can cause people to change their behaviour by, for example, staying at home and avoiding social contacts. Such changes can be used to control epidemics but they exact an economic cost. Our aim is to study the costs and benefits of using individual-based social distancing undertaken by healthy individuals as a form of control.

Methods: Our model is a standard SIR model superimposed on a spatial network, without and with addition of small-world interactions. Disease spread is controlled by allowing susceptible individuals to temporarily reduce their social contacts in response to the presence of infection within their local neighbourhood. We ascribe an economic cost to the loss of social contacts, and weigh this against the economic benefit gained by reducing the impact of the epidemic. We study the sensitivity of the results to two key parameters, the individuals' attitude to risk and the size of the awareness neighbourhood.

Results: Depending on the characteristics of the epidemic and on the relative economic importance of making contacts versus avoiding infection, the optimal control is one of two extremes: either to adopt a highly cautious control, thereby suppressing the epidemic quickly by drastically reducing contacts as soon as disease is detected; or else to forego control and allow the epidemic to run its course. The worst outcome arises when control is attempted, but not cautiously enough to cause the epidemic to be suppressed. The next main result comes from comparing the size of the neighbourhood of which individuals are aware to that of the neighbourhood within which transmission can occur. The control works best when these sizes match and is particularly ineffective when the awareness neighbourhood is smaller than the infection neighbourhood. The results are robust with respect to inclusion of long-range, small-world links which destroy the spatial structure, regardless of whether individuals can or cannot control them. However, addition of many non-local links eventually makes control ineffective.

Conclusions: These results have implications for the design of control strategies using social distancing: a control that is too weak or based upon inaccurate knowledge, may give a worse outcome than doing nothing.


Figures

Figure 1
Figure 1
Structure of the awareness and infection neighbourhoods for the case with a small infection pressure (a) and large infection pressure (b). Susceptible individuals are shown as grey circles and infected individuals as black circles. For clarity no recovered individuals are shown in this example and only individuals in the awareness neighbourhood (large dotted circle) are represented. The infection neighbourhood (thick-lined circle) varies in response to increased infection pressure (cf. (b) with (a)).
Figure 2
Figure 2
Block diagram illustrating transitions in the model considered in the paper. Solid lines represent transitions performed at each time step. Dashed line illustrates change in behaviour influenced by infection pressure. Dotted lines identify parameters affecting each transition.
Figure 3
Figure 3
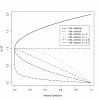
The role of risk attitude in modifing the number of contacts in response to the local infection pressure. The curves illustrate (from top to bottom) risk-seeking, risk-neutral, and increasingly more risk-averse.
Figure 4
Figure 4
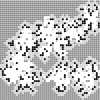
Snapshot of a simulation run. As the epidemic progresses, susceptibles (grey) close to infected (black) individuals become aware of their presence and reduce their social contacts. This results in a wall of cautious (light grey) susceptibles surrounding the infecteds, containing the epidemic and preventing it from reaching those further away. White areas indicate recovered individuals.
Figure 5
Figure 5
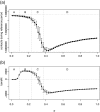
Effect of control on the final size of the epidemic, R(a) and epidemic duration,T(b). Black lines indicate the result with control, and light grey indicates the result with no control. Each point is the mean of 20 simulation runs with error bars showing ±1 standard deviation. The parameter values are: q = 0.5, ri(0)=2, ra = 2, α = 0.25.
Figure 6
Figure 6
Number of contacts (a) and net economic benefit (b) as functions ofp. Black lines indicate the result with control, and light grey indicates the result with no control. Each point is the mean of 20 simulation runs with error bars showing ±1 standard deviation. The parameter values are: q = 0.5, ri(0)=2, ra = 2, α = 0.25, and c = 0.05.
Figure 7
Figure 7
Net economic benefit as a function of p, for c = 0, c = 0.05 and c = 0.1. Each point is the mean of 20 simulation runs with error bars showing ±1 standard deviation. The parameter values are: q = 0.5, ri(0)=2, ra = 2, and α = 0.25.
Figure 8
Figure 8
Net economic benefit as a function of p, for α = 0.05, α = 0.25 and α = 0.55. Each point is the mean of 20 simulation runs with error bars showing ±1 standard deviation. Parameters: q = 0.5, c = 0.05, ri(0)=2 and ra = 2. Only region A is marked as the locations of regions B, C, and D vary with α.
Figure 9
Figure 9
Net economic benefit as a function of α, for p = 0.01, p = 0.25 and p = 0.51. Each point is the mean of 20 simulation runs with error bars showing ±1 standard deviation. Parameters: q = 0.5, c = 0.05, ri(0)=2 and ra = 2.
Figure 10
Figure 10
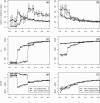
Duration (a) and (b), the final size of the epidemic (c) and (d) and the net benefit (e) and (f) as a function of αfor different numbers of long-range random links. Each point is the mean of 20 simulation runs with error bars showing ±1 standard deviation. Parameters: p = 0.25, q = 0.5, c = 0.05, ri(0)=2 and ra = 2. 20% corresponds to 3,000 links, 30% to 4,500 and 100% represents a fully random network.
Figure 11
Figure 11
Net economic benefit as a function of α, for different values of ra. Each point is the mean of 20 simulation runs with error bars showing ±1 standard deviation. Parameters: p = 0.25, q = 0.5, c = 0.05, ri(0)=2 and ra takes the values 1, 2 (= ri(0)), and 3 in (a) and 2 (= ri(0)), 10 and in (b). Note the change of vertical scale between (a) and (b). ra = is modelled by making the awareness neighbourhood sufficiently large to include the whole population.
Figure 12
Figure 12
Net economic benefit as a function of α, for ra = 2 (local awareness) and ra = (global awareness) for fully random network. Each point is the mean of 20 simulation runs with error bars showing ±1 standard deviation. Parameters: p = 0.25, q = 0.5, c = 0.05, ri(0)=2.

References

    1. Small M, Tse C. Clustering model for transmission of the SARS virus: application to epidemic control and risk assessment. Physica A: Stat Mech its App. 2005;351(2-4):499–511. - PMC - PubMed
    1. Kiss IZ, Green DM, Kao RR. Infectious disease control using contact tracing in random and scale-free networks. J R Soc, Interface / R Soc. 2006;3(6):55–62. - PMC - PubMed
    1. Meyers L, Pourbohloul B, Newman M, Skowronski D, Brunham R. Network theory and, SARS: predicting outbreak diversity. J theor biol. 2005;232:71–81. - PMC - PubMed
    1. Ferguson NM, Cummings DAT, Cauchemez S, Fraser C, Riley S, Meeyai A, Iamsirithaworn S, Burke DS. Strategies for containing an emerging influenza pandemic in Southeast Asia. Nature. 2005;437:209–214. - PubMed
    1. Cauchemez S, Bhattarai A, Marchbanks TL, Fagan RP, Ostroff S, Ferguson NM, Swerdlow D. Role of social networks in shaping disease transmission during a community outbreak of 2009 H1N1 pandemic influenza. Proc National Acad Sci USA. 2011;108(7):2825–2830. - PMC - PubMed

Publication types

LinkOut - more resources