

Interrogation of brain miRNA and mRNA expression profiles reveals a molecular regulatory network that is perturbed by mutant huntingtin
- PMID: 22906125
- PMCID: PMC3472040
- DOI: 10.1111/j.1471-4159.2012.07925.x
Interrogation of brain miRNA and mRNA expression profiles reveals a molecular regulatory network that is perturbed by mutant huntingtin
Abstract
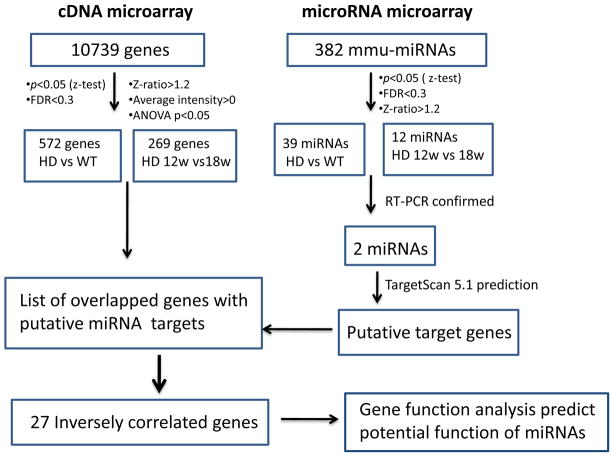
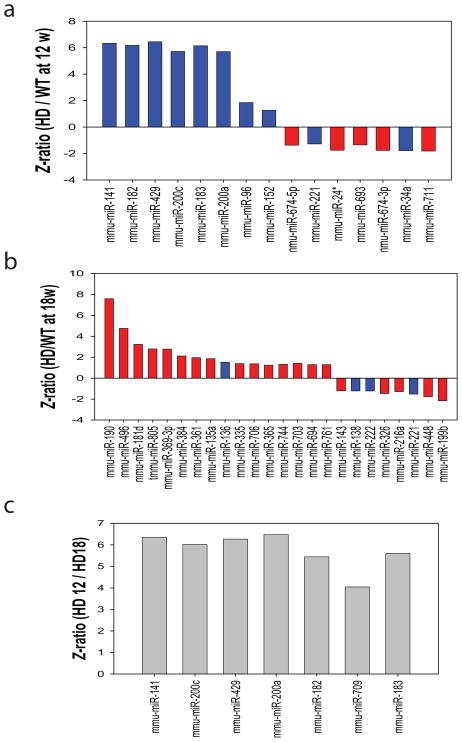
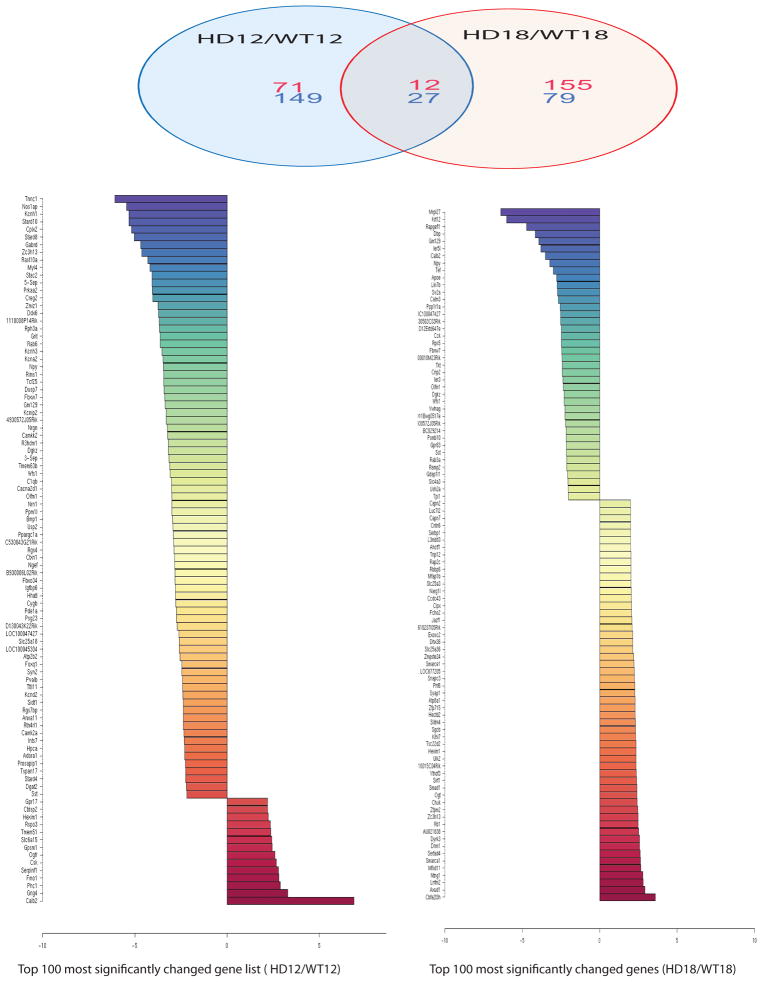
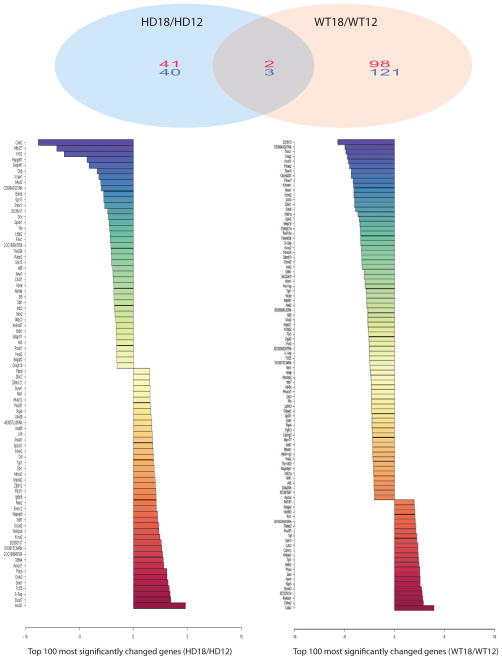
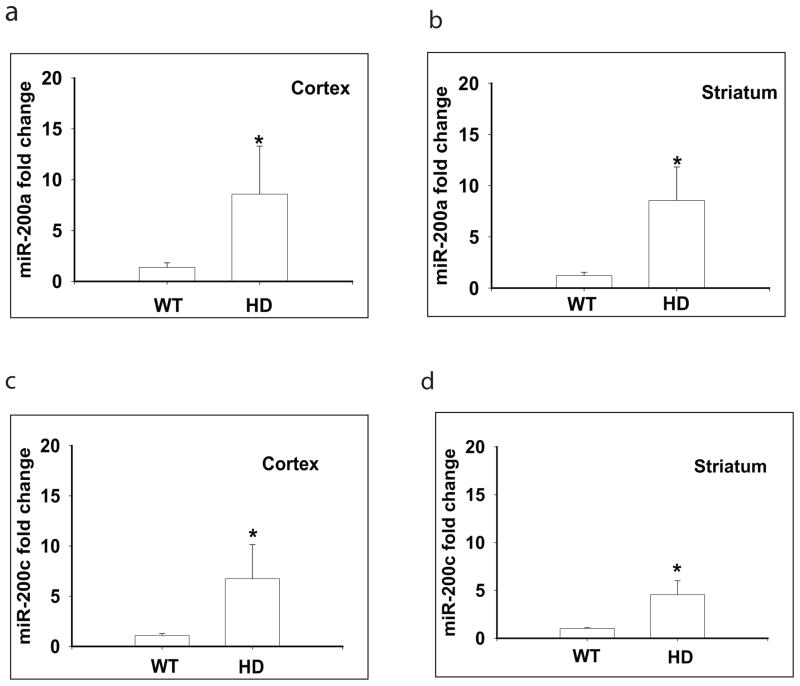
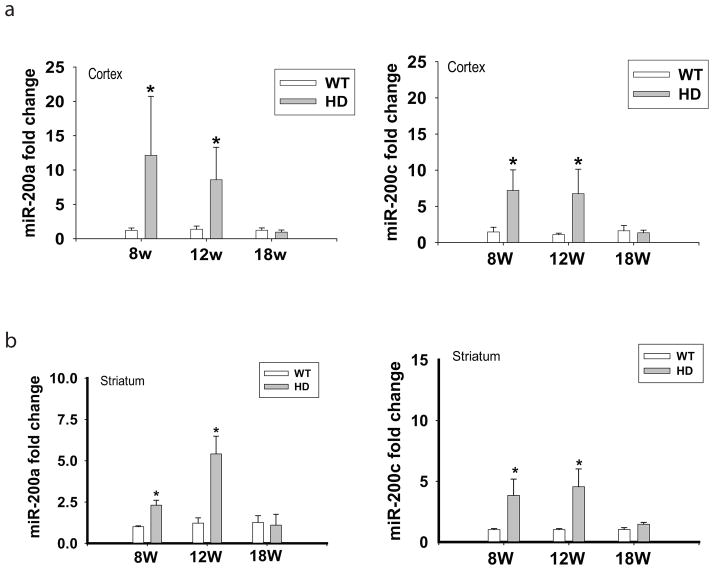
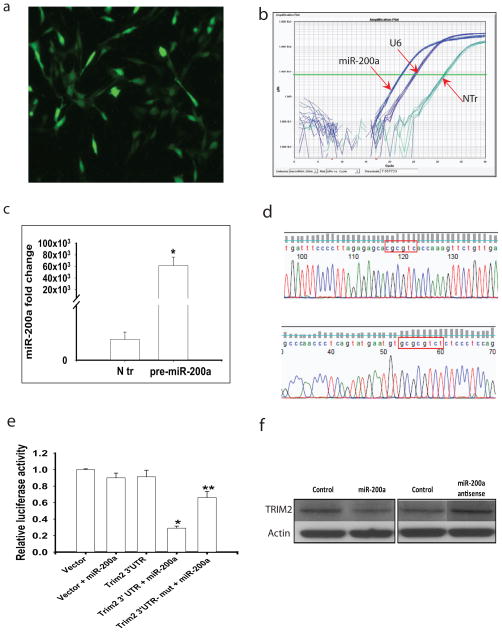
Emerging evidence indicates that microRNAs (miRNAs) may play an important role in the pathogenesis of Huntington's disease (HD). To identify the individual miRNAs that are altered in HD and may therefore regulate a gene network underlying mutant huntingtin-induced neuronal dysfunction in HD, we performed miRNA array analysis combined with mRNA profiling in the cerebral cortex from N171-82Q HD mice. Expression profiles of miRNAs as well as mRNAs in HD mouse cerebral cortex were analyzed and confirmed at different stages of disease progression; the most significant changes of miRNAs in the cerebral cortex were also detected in the striatum of HD mice. Our results revealed a significant alteration of miR-200 family members, miR-200a, and miR-200c in the cerebral cortex and the striatum, at the early stage of disease progression in N171-82Q HD mice. We used a coordinated approach to integrate miRNA and mRNA profiling, and applied bioinformatics to predict a target gene network potentially regulated by these significantly altered miRNAs that might be involved in HD disease progression. Interestingly, miR-200a and miR-200c are predicted to target genes regulating synaptic function, neurodevelopment, and neuronal survival. Our results suggest that altered expression of miR-200a and miR-200c may interrupt the production of proteins involved in neuronal plasticity and survival, and further investigation of the involvement of perturbed miRNA expression in HD pathogenesis is warranted, and may lead to reveal novel approaches for HD therapy.
© 2012 The Authors Journal of Neurochemistry © 2012 International Society for Neurochemistry.
Conflict of interest statement
All authors have no conflict of interest to declare.
Figures
Similar articles
-
Increased huntingtin protein length reduces the number of polyglutamine-induced gene expression changes in mouse models of Huntington's disease.Hum Mol Genet. 2002 Aug 15;11(17):1939-51. doi: 10.1093/hmg/11.17.1939. Hum Mol Genet. 2002. PMID: 12165556
-
Transgenic mice expressing mutated full-length HD cDNA: a paradigm for locomotor changes and selective neuronal loss in Huntington's disease.Philos Trans R Soc Lond B Biol Sci. 1999 Jun 29;354(1386):1035-45. doi: 10.1098/rstb.1999.0456. Philos Trans R Soc Lond B Biol Sci. 1999. PMID: 10434303 Free PMC article.
-
Altered microRNA regulation in Huntington's disease models.Exp Neurol. 2011 Jan;227(1):172-9. doi: 10.1016/j.expneurol.2010.10.012. Epub 2010 Oct 28. Exp Neurol. 2011. PMID: 21035445
-
Transcriptional dysregulation of coding and non-coding genes in cellular models of Huntington's disease.Biochem Soc Trans. 2009 Dec;37(Pt 6):1270-5. doi: 10.1042/BST0371270. Biochem Soc Trans. 2009. PMID: 19909260 Review.
-
The early cellular pathology of Huntington's disease.Mol Neurobiol. 1999 Oct-Dec;20(2-3):111-24. doi: 10.1007/BF02742437. Mol Neurobiol. 1999. PMID: 10966117 Review.
Cited by
-
MicroRNAs in Neurocognitive Dysfunctions: New Molecular Targets for Pharmacological Treatments?Curr Neuropharmacol. 2017;15(2):260-275. doi: 10.2174/1570159x14666160709001441. Curr Neuropharmacol. 2017. PMID: 27396304 Free PMC article. Review.
-
Copper-Induced Upregulation of MicroRNAs Directs the Suppression of Endothelial LRP1 in Alzheimer's Disease Model.Toxicol Sci. 2019 Jul 1;170(1):144-156. doi: 10.1093/toxsci/kfz084. Toxicol Sci. 2019. PMID: 30923833 Free PMC article.
-
Hippocampal Transcriptomic and Proteomic Alterations in the BTBR Mouse Model of Autism Spectrum Disorder.Front Physiol. 2015 Nov 24;6:324. doi: 10.3389/fphys.2015.00324. eCollection 2015. Front Physiol. 2015. PMID: 26635614 Free PMC article.
-
Neuronal dark matter: the emerging role of microRNAs in neurodegeneration.Front Cell Neurosci. 2013 Oct 10;7:178. doi: 10.3389/fncel.2013.00178. Front Cell Neurosci. 2013. PMID: 24133413 Free PMC article. Review.
-
miR-10b-5p expression in Huntington's disease brain relates to age of onset and the extent of striatal involvement.BMC Med Genomics. 2015 Mar 1;8:10. doi: 10.1186/s12920-015-0083-3. BMC Med Genomics. 2015. PMID: 25889241 Free PMC article.
References
-
- Augood SJ, Faull RL, Emson PC. Dopamine D1 and D2 receptor gene expression in the striatum in Huntington’s disease. Ann Neurol. 1997a;42:215–221. - PubMed
-
- Augood SJ, Westmore K, Emson PC. Phenotypic characterization of neurotensin messenger RNA-expressing cells in the neuroleptic-treated rat striatum: a detailed cellular co-expression study. Neuroscience. 1997b;76:763–774. - PubMed
Publication types
MeSH terms
Substances
Grants and funding
LinkOut - more resources
Full Text Sources
Medical
