. 2012 Aug 20;13(8):R70.
doi: 10.1186/gb-2012-13-8-r70.

The mouse DXZ4 homolog retains Ctcf binding and proximity to Pls3 despite substantial organizational differences compared to the primate macrosatellite

The mouse DXZ4 homolog retains Ctcf binding and proximity to Pls3 despite substantial organizational differences compared to the primate macrosatellite

Andrea H Horakova et al. Genome Biol. .

Abstract

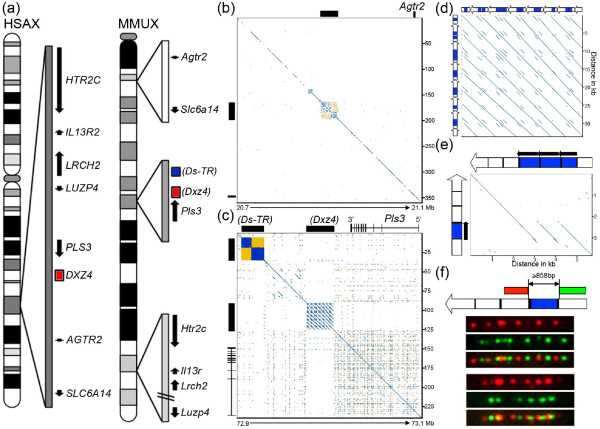
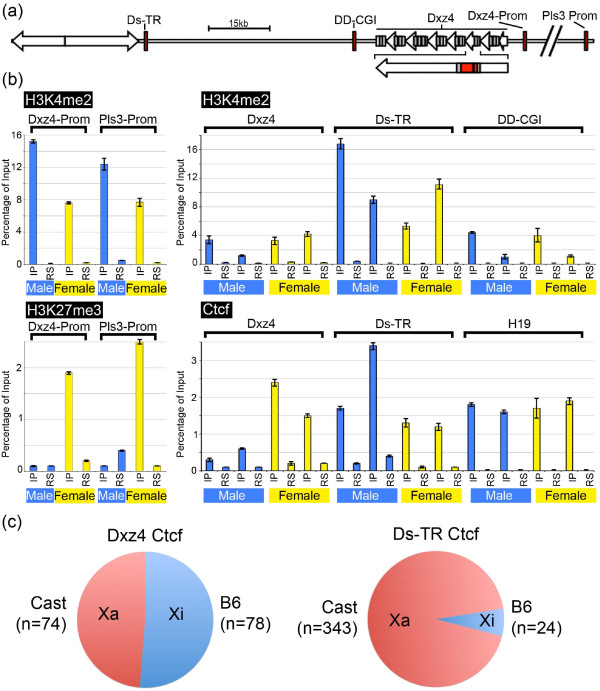
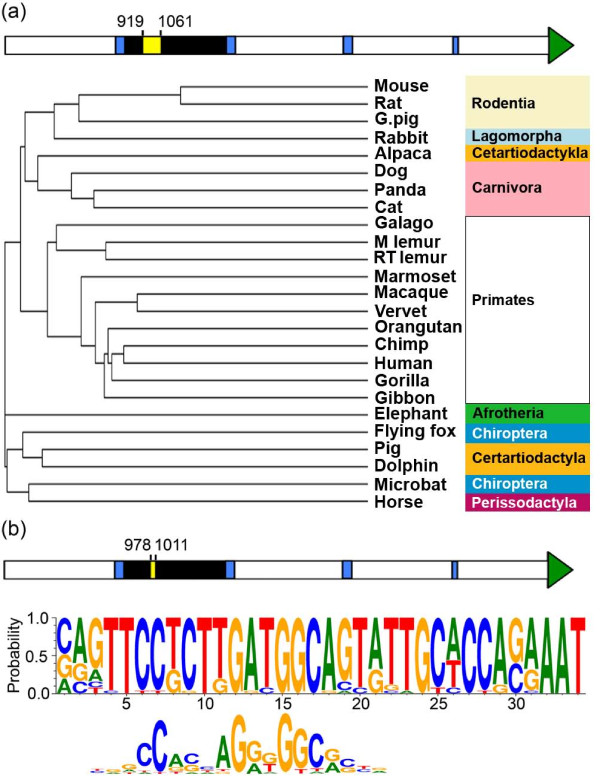
Background: The X-linked macrosatellite DXZ4 is a large homogenous tandem repeat that in females adopts an alternative chromatin organization on the primate X chromosome in response to X-chromosome inactivation. It is packaged into heterochromatin on the active X chromosome but into euchromatin and bound by the epigenetic organizer protein CTCF on the inactive X chromosome. Because its DNA sequence diverges rapidly beyond the New World monkeys, the existence of DXZ4 outside the primate lineage is unknown.

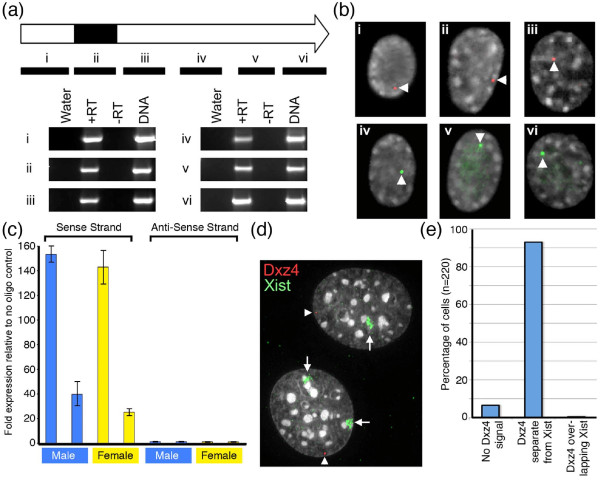
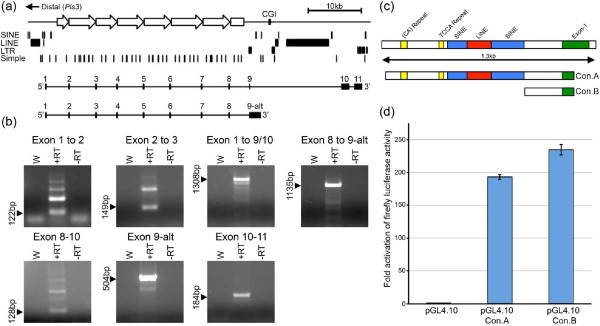
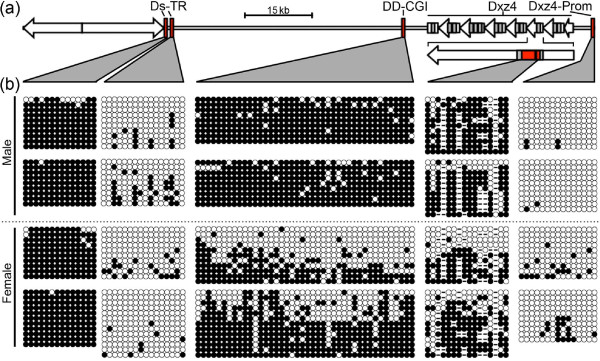
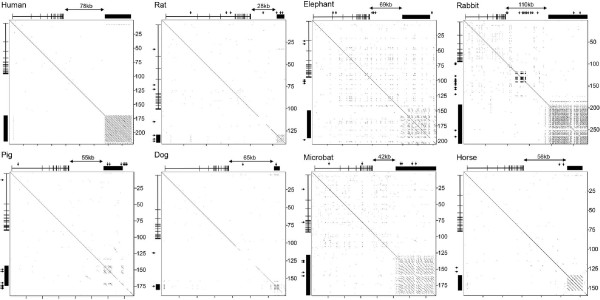
Results: Here we extend our comparative genome analysis and report the identification and characterization of the mouse homolog of the macrosatellite. Furthermore, we provide evidence of DXZ4 in a conserved location downstream of the PLS3 gene in a diverse group of mammals, and reveal that DNA sequence conservation is restricted to the CTCF binding motif, supporting a central role for this protein at this locus. However, many features that characterize primate DXZ4 differ in mouse, including the overall size of the array, the mode of transcription, the chromatin organization and conservation between adjacent repeat units of DNA sequence and length. Ctcf binds Dxz4 but is not exclusive to the inactive X chromosome, as evidenced by association in some males and equal binding to both X chromosomes in trophoblast stem cells.

Conclusions: Characterization of Dxz4 reveals substantial differences in the organization of DNA sequence, chromatin packaging, and the mode of transcription, so the potential roles performed by this sequence in mouse have probably diverged from those on the primate X chromosome.


Figures

Figure 1
Figure 1
Genomic characterization of the mouse Dxz4 locus. (a) Ideograms of the human (HSAX) and mouse (MMUX) X chromosomes. Regions relevant to the search for Dxz4 are expanded to the right of the chromosome. Genes are represented by solid arrows pointing in the direction of transcription. Length represents extent of the gene. Human DXZ4 is represented as the red box. The location of the putative Dxz4 homolog and the downstream tandem repeat are highlighted proximal to mouse Pls3 as red and blue boxes, respectively. (b) Pair-wise alignment of approximately 360 kb (scale in kilobases given on the y-axis) downstream of the mouse Agtr2 gene (20.7 to 21.1 Mb, mm9, indicated for the x-axis). Sequence similarity is shown in blue with inverted similarity in yellow. Black bars on the top and left edges indicate extensive repeats. (c) Pair-wise alignment of approximately 240 kb encompassing the Pls3 gene (72.9 to 73.1 Mb, mm9) and distal sequence. (d) Pairwise alignment of the 36-kb mouse Dxz4 array. The block arrows on the top and left edges represent Dxz4 tandem repeat monomers. (e) Pairwise alignment of the largest and smallest Dxz4 monomers (block arrows on top and left edges) highlighting the existence of an internal variable number tandem repeat (VNTR) represented by the black arrows above the blue boxes. Perpendicular black lines within the monomers indicate the locations of simple repeats. (f) Extended DNA fiber fluorescence in situ hybridization (FISH) of the Dxz4 array. At the top is a schematic of a single Dxz4 monomer. The regions of Dxz4 used to generate direct-labeled FISH probes are indicated to the left (red) and right (green) of the VNTR (blue). Immediately below are examples of hybridization results. All pairwise alignments used the DNA sequence compared with a repeat-masked version of itself with the exception of that shown in (c), which compared non-repeat-masked sequences to show the inverted satellite repeat. Alignments were all made with YASS [71], and the output was pseudocolored to avoid red-green.
Figure 2
Figure 2
Characterization of unspliced Dxz4 transcript. (a) Schematic map of a Dxz4 monomer. The internal VNTR is represented by the black box. Below it are indicated six intervals (i to vi) assessed by reverse-transcription PCR (RT-PCR). The RT-PCR results for i to vi are given as images of ethidium bromide-stained agarose gels for NIH/3T3 complementary DNA (cDNA). Samples include water (W), RNA incubated with (+RT) and without (-RT) reverse transcriptase, and genomic DNA. (b) RNA FISH results of direct-labeled Spectrum-Orange or Spectrum-Green probes for regions i to vi in NIH/3T3 cells. Signals are indicated by white arrows merged with DAPI (black and white). (c) Strand-specific quantitative RT-PCR analysis of Dxz4 expression in two independent male and female samples. Graph shows fold expression of dxz4 in sense (left) and anti-sense (right) primed cDNA relative to cDNA prepared with no gene-specific primer. Error bars show standard deviation. (d) RNA FISH analysis of unspliced Dxz4 (red) and Xist RNA (green) merged with DAPI (black and white) in female cells. Dxz4 indicated by the white arrowheads and inactive X chromosome-specific transcript (Xist) by the white arrows. (e) Frequency of Dxz4 RNA FISH signals overlapping Xist in female cells.
Figure 3
Figure 3
Expression of spliced Dxz4 and promoter characterization. (a) Schematic map of the Dxz4 region representing 72.95 to 73.01 Mb of the mouse X chromosome (mm9). The map is inverted for simplicity and the distal direction toward Pls3 indicated. Open block arrows represent Dxz4 monomers. A downstream CGI is indicated. Immediately below is a map indicating location and type of repeat elements for the interval: LINE, long interspersed nuclear element; LTR, long terminal repeat; SINE, short interspersed nuclear element. Below that are the maps of two putative alternatively spliced transcripts based on expressed sequence tag evidence. (b) Confirmation of spliced transcripts by RT-PCR. Each of the seven panels is an image of an ethidium bromide-stained agarose gel showing RT-PCR results for PCR between the exons indicated above. To the left of each image is the predicted product size. Samples include water control (W) and RNA incubated with (+RT) and without (-RT) reverse transcriptase. (c) DNA sequence feature map of the 1.3-kb region immediately upstream of Dxz4 exon 1 (green). Repetitive elements are indicated above the corresponding colored boxes. Immediately below are the regions cloned upstream of a promoterless luciferase reporter gene: construct A (Con.A) and construct B (Con.B). (d) Luciferase activity measured in NIH/3T3 cell extracts 72 hours after transfection with the promoterless luciferase vector (pGL4.10) or the same vector containing inserts for construct A or B. Fold activation of luciferase is shown to the left. Data represent the mean and standard deviation of replicate experiments each performed in triplicate.
Figure 4
Figure 4
DNA methylation of elements in the vicinity of Dxz4. (a) Schematic map of the region encompassing Dxz4 and the downstream satellite repeat (diverging open arrows). Left-pointing arrows represent Dxz4, and the location of the Dxz4 promoter and CGI are indicated. The red boxes indicate regions assessed for DNA methylation by PCR of bisulfite-modified DNA, cloning, and sequencing. The location of bisulfite analysis within the Dxz4 array is shown for a single monomer immediately below the array. (b) Cytosine methylation at CpG dinucleotides for the five regions shown in (a). Data are given for two independent males (top) and two independent females (bottom). Methylated cytosine is represented by a black circle whereas unmethylated is represented by an open circle. DNA variants that result in a sequence that is no longer a CpG are represented by dashes. Each row of circles represents DNA sequence obtained from a single clone, and each set of data consists of at least nine independent clones.
Figure 5
Figure 5
Characterization of chromatin in the vicinity of Dxz4. (a) Schematic map of the region encompassing Dxz4 and the downstream satellite repeat (diverging open arrows). Left-pointing facing arrows represent Dxz4, and the location of the CGI and promoters for Dxz4 and Pls3 are indicated. The angled double strike through the map between the Dxz4 and Pls3 promoters represents an approximately 114-kb gap. The red boxes indicate the regions assessed by chromatin immunoprecipitation (ChIP)-PCR. (b) Graphs showing results of ChIP assayed by quantitative PCR. The mean and standard deviation for the ChIP elution (IP) and for a negative control rabbit serum (RS) are shown as percentage of the input. For H3K4me2 and H3K27me3 at the Dxz4 promoter (Dxz4-Prom) and Pls3 promoter (Pls3-Prom), data for one male and one female are shown. For H3K4me2 and Ctcf at Dxz4, DS-TR and DD-CGI, data are shown for two independent male and female samples. (c) Pie charts showing the percentage of C57BL/6J (B6) or castaneous (Cast) informative allele calls for Ctcf ChIP-Seq fragments for Dxz4 and the downstream tandem repeat (Ds-TR) Ctcf binding sites.
Figure 6
Figure 6
Identification of a tandem repeat downstream of PLS3 in eight different mammals. Pairwise alignment of genomic DNA sequence encompassing and extending downstream of PLS3 for each mammal (labeled above each plot). The structure and location of PLS3 is indicated on the top and left edge of each alignment. Distance in kilobases is indicated to the right of each plot. The distance between the 3' end of PLS3 and the downstream tandem repeat is highlighted above each plot. The extent of the tandem repeat is highlighted by the black bar above and to the left of each plot. Arrows pointing down from the top or rightward from the left edge indicate gaps in the genome assembly.
Figure 7
Figure 7
Identification of a conserved DNA sequence element with homology to a CTCF consensus sequence in mammalian DXZ4. (a) Schematic representation of a mouse Dxz4 monomer. The green arrowhead indicates the spliced exon. The blue vertical bars indicate repeat-masked sequence. The black bar represents the VNTR. The yellow box within the VNTR (bases 919 to 1,061) represents the conserved Dxz4 sequence. This sequence was used to align to the corresponding sequences from the mammals listed to generate the cladogram. The tree image was generated with MUSCLE version 3.8 [72] and ClustalW2 [73]. Classification of the groups is given to the right. (b) Schematic representation of a mouse Dxz4 monomer as above. The yellow box within the VNTR (bases 978 to 1,011) represents the DNA sequence that contains nucleotides invariable in all mammalian DXZ4 sequences assessed. This 34-bp sequence from each mammal was used to generate the position weight matrix through WebLogo [55]. Beneath the matrix is a previously determined Ctcf consensus sequence that is adapted from Martin et al. [47]. Note that the position weight matrix is the reverse complement of that shown in the referenced manuscript.

Similar articles

Cited by

References

    1. de Koning AP, Gu W, Castoe TA, Batzer MA, Pollock DD. Repetitive elements may comprise over two-thirds of the human genome. PLoS Genet. 2011;7:e1002384. doi: 10.1371/journal.pgen.1002384. - DOI - PMC - PubMed
    1. Lander ES, Linton LM, Birren B, Nusbaum C, Zody MC, Baldwin J, Devon K, Dewar K, Doyle M, FitzHugh W, Funke R, Gage D, Harris K, Heaford A, Howland J, Kann L, Lehoczky J, LeVine R, McEwan P, McKernan K, Meldrim J, Mesirov JP, Miranda C, Morris W, Naylor J, Raymond C, Rosetti M, Santos R, Sheridan A, Sougnez C. et al.Initial sequencing and analysis of the human genome. Nature. 2001;409:860–921. doi: 10.1038/35057062. - DOI - PubMed
    1. Hannan AJ. Tandem repeat polymorphisms: modulators of disease susceptibility and candidates for "missing heritability.". Trends Genet. 2010;26:59–65. doi: 10.1016/j.tig.2009.11.008. - DOI - PubMed
    1. Ellegren H. Microsatellites: simple sequences with complex evolution. Nat Rev Genet. 2004;5:435–445. - PubMed
    1. Warburton PE, Hasson D, Guillem F, Lescale C, Jin X, Abrusan G. Analysis of the largest tandemly repeated DNA families in the human genome. BMC Genomics. 2008;9:533. doi: 10.1186/1471-2164-9-533. - DOI - PMC - PubMed

Publication types

MeSH terms