. 2012 Nov;84(4):330-43.
doi: 10.1016/j.diff.2012.07.006. Epub 2012 Aug 18.

Differential responses to retinoic acid and endocrine disruptor compounds of subpopulations within human embryonic stem cell lines

Affiliations

Differential responses to retinoic acid and endocrine disruptor compounds of subpopulations within human embryonic stem cell lines

Lois A Annab et al. Differentiation. 2012 Nov.

Abstract

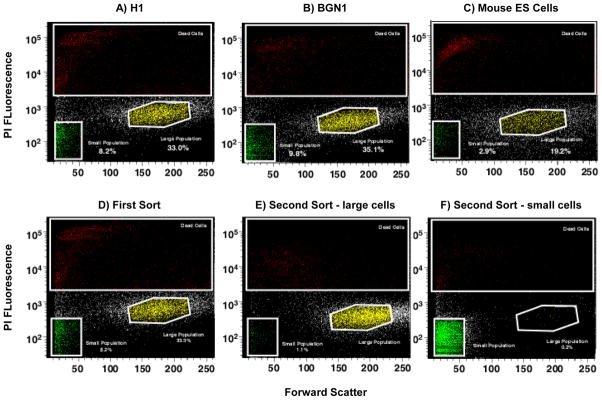
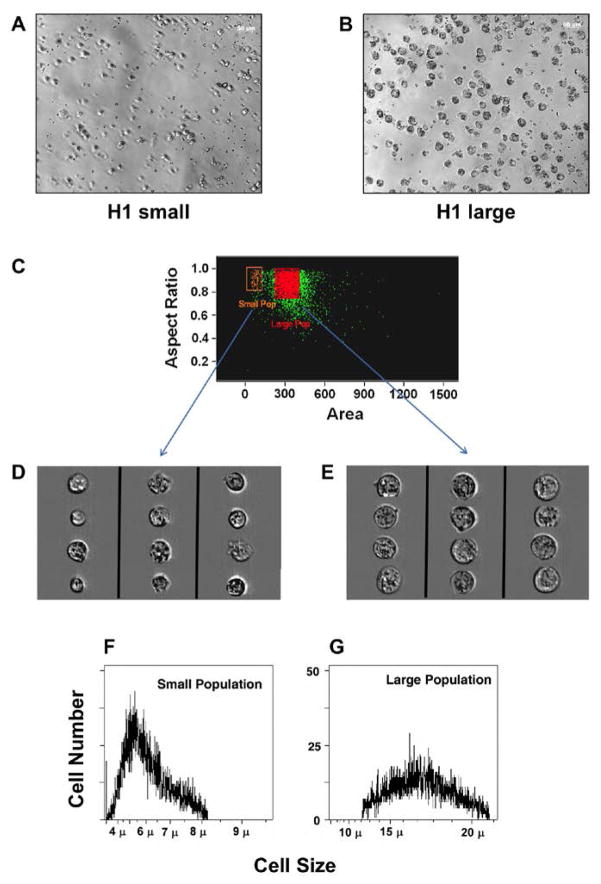
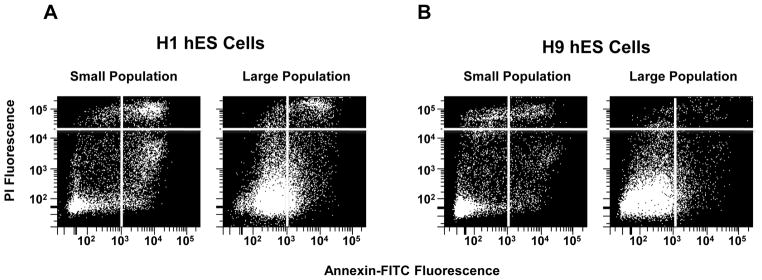
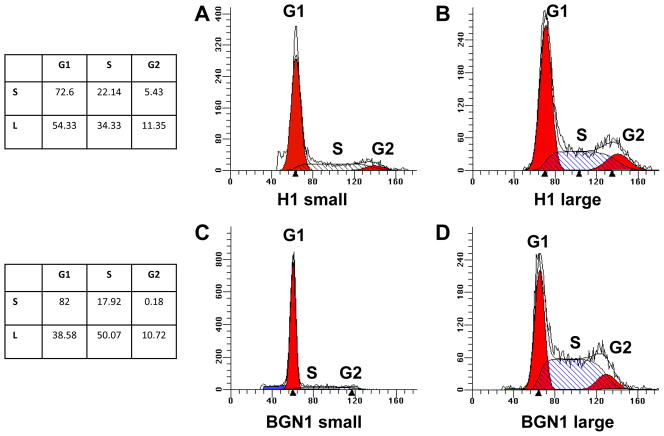
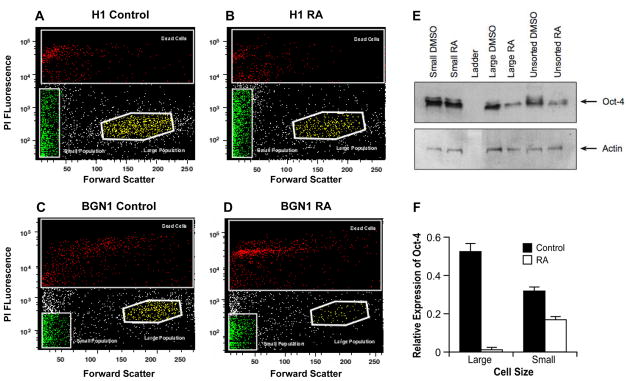
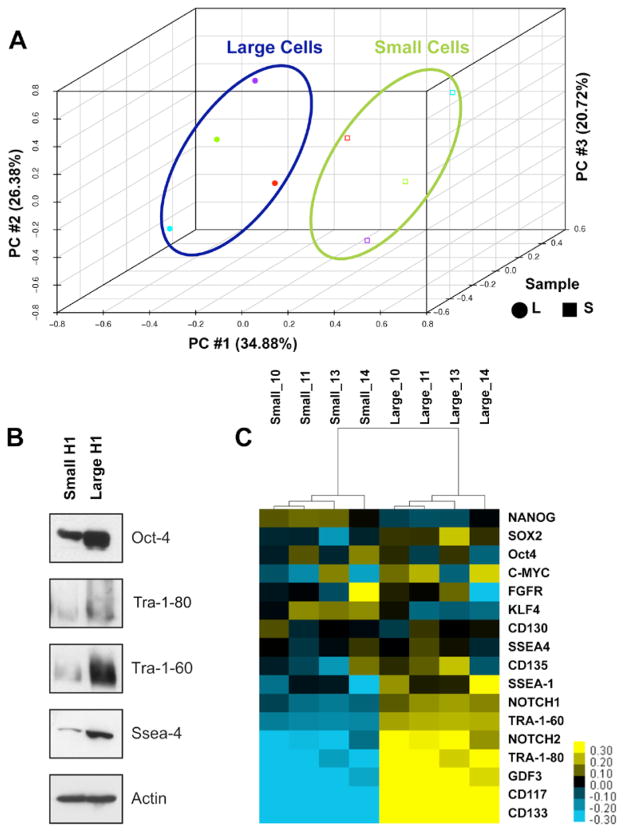
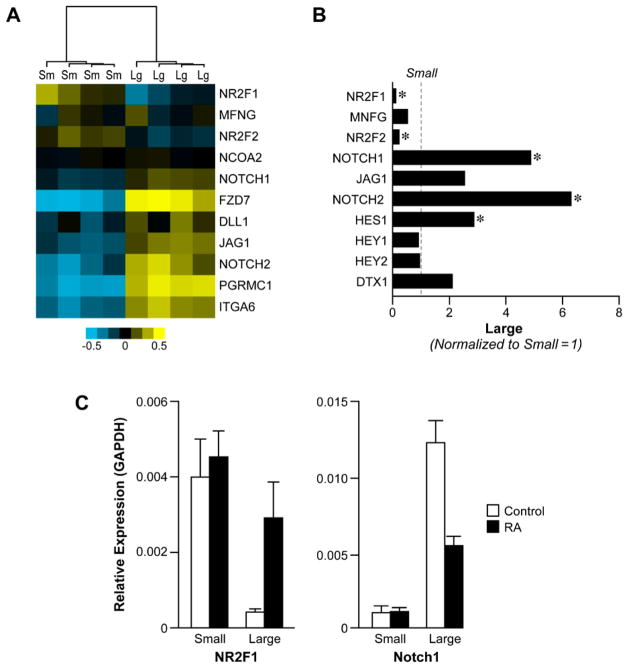
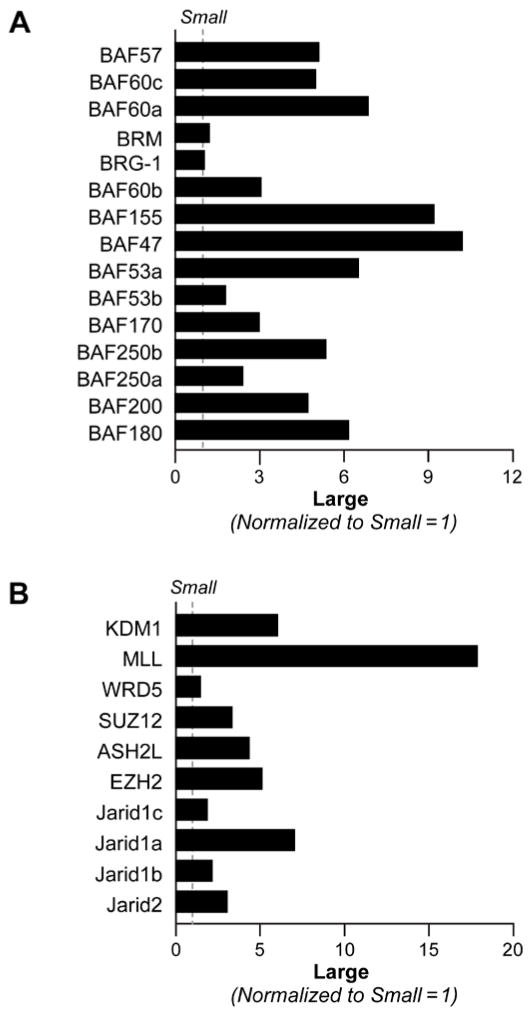
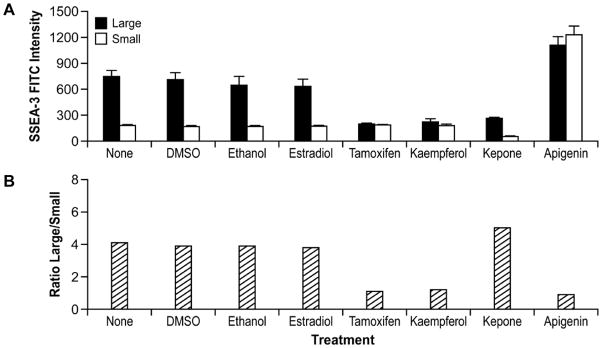
The heterogeneous nature of stem cells is an important issue in both research and therapeutic use in terms of directing cell lineage differentiation pathways, as well as self-renewal properties. Using flow cytometry we have identified two distinct subpopulations by size, large and small, within cultures of human embryonic stem (hES) cell lines. These two cell populations respond differentially to retinoic acid (RA) differentiation and several endocrine disruptor compounds (EDC). The large cell population responds to retinoic acid differentiation with greater than a 50% reduction in cell number and loss of Oct-4 expression, whereas the number of the small cell population does not change and Oct-4 protein expression is maintained. In addition, four estrogenic compounds altered SSEA-3 expression differentially between the two cell subpopulations changing their ratios relative to each other. Both populations express stem cell markers Oct-4, Nanog, Tra-1-60, Tra-1-80 and SSEA-4, but express low levels of differentiation markers common to the three germ layers. Cloning studies indicate that both populations can revive the parental population. Furthermore, whole genome microarray identified approximately 400 genes with significantly different expression between the two populations (p<0.01). We propose the differential response to RA in these populations is due to differential gene expression of Notch signaling members, CoupTF1 and CoupTF2, chromatin remodeling and histone modifying genes that render the small population resistant to RA differentiation. The findings that hES cells exist as heterogeneous populations with distinct responses to differentiation signals and environmental stimuli will be relevant for their use for drug discovery and disease therapy.


Figures

Figure 1
Figure 1. Stem cells display heterogeneous populations
Identification of two PI negative viable subpopulations of ES cells gated by size using flow cytometry with forward and side scatter. Human and mouse embryonic cell profile exhibiting two viable populations based on size indicated as large and small populations. A) H1 hES cells. B) BGN1 hES cells. C) Mouse ES cells. D) Whole population of H1 hES cells sorted and gated by size after PI treatment to remove dead cells. E) H1 Large population of gated re-sorted cells from figure 1D. F) Small population of gated re-sorted cells from figure 1D.
Figure 2
Figure 2. Two viable populations of hES have distinct sizes
Isolation of cells from the two subpopulations using different methods, demonstrated viability and size differences. A) Microphotograph of H1 small cells sorted for size. B) Microphotograph of H1 large cells resorted for size. C) Image stream analysis of PI negative small and large populations stained with DRAQ5. D) Image stream analysis of small cells E) Image stream analysis of large cells. F) Cell Lab Quanta SC Analysis of cell size for small cells. G) Large cells.
Figure 3
Figure 3. Majority of small and large cell populations are viable
H1 and H9 hES cells were stained for Annexin-V-FITC and PI and then sorted for large and small populations. Annexin-V-FITC vs IP fluorescence was determined and divided into four quadrants for analysis. A) H1 quadrant distributions of small and large cells showing the majority (60 – 80%) fall into quadrant 3 which represent viable non-apoptotic cells that are negative for Annexin-V and negative for PI B) Annexin-V-FITC and PI quadrant expression levels of H9 hES cell small and large cell populations.
Figure 4
Figure 4. Cell cycle profiles of large and small populations of hES cells
H1 and BGN1 hES cell cycle profiles of large and small populations identifying percentage of cells in G0–G1, S-phase (hatch bars) and G2 using the PI method of staining and Mod-fit software A) H1 hES cell cycle profile of the small population B) H1 hES cell cycle profile of the large population C) BGN1 hES small population cell cycle profile D) BGN1 hES cell large population cell cycle profile.
Figure 5
Figure 5. Differential response of the two populations to retinoic acid treatment
Flow cytometry forward vs. side scatter profiles of distribution of large and small H1 and BGN1 hES cells after 12-day treatment with RA or DMSO. A) Forward/Side scatter of H1 cells treated for 12 days with DMSO. B) H1 cell distribution of subpopulations treated for 12 days with RA. C) BGN1 cells treated with DMSO. D) BGN1 cells treated with RA. E) Oct-4 protein expression in H1 hES cells treated with DMSO or retinoic acid. Actin is used as a loading control. F) Oct-4 mRNA expression in H1 hES large and small population after 12 days of RA treatment.
Figure 6
Figure 6. Differential expression of stem cell markers in two subpopulations of H1 hES cells
A) PCA analysis using the whole genome microarray data indicates clear separation between H1 hES Cell large and small subpopulations. B) A heat map depicting expression of stem cell marker and associated genes in 4 biological replicates of large and small subpopulation. Yellow indicates higher expression and blue indicates a lower expression of individual genes within the two populations. C) Protein expression of key stem cell markers, Tra-1-60, Tra-1-81, and SSEA-4 within the two populations. Actin is used as loading control.
Figure 7
Figure 7. Differential expression of notch signaling pathway genes and CoupTF1&2
A) Heat map depicting expression of Notch signaling components and orphan receptors, CoupTF1 and CoupTF2 in H1 hES small and large cell population. B) mRNA expression of CoupTF1&2 and notch signaling pathway genes. mRNA expression is normalized to small cell population. C) Relative mRNA expression of CoupTF1 and Notch1 after treating the small and large cell population with RA for 6 days.
Figure 8
Figure 8. Differential mRNA expression of chromatin remodeling and histone modifying genes between small and large cell populations
A) Quantitative RT-PCR analysis showing mRNA expression of BRG1 associated factors within the SWI/SNF complex in H1 hES small and large cell populations. mRNA expression is normalized to the levels expressed in small population. B) ) Quantitative RT-PCR analysis showing mRNA expression of histone modifying enzymes in H1 hES small and large cell populations. mRNA expression is normalized to the levels expressed in small population.
Figure 9
Figure 9. Differential responses by subpopulations to treatment with endocrine disruptor compounds
A) H9 hES cells were grown and exposed to EDC for 2 days and hybridized with SSEA-3-FITC and then sorted for large and small populations expressing SSEA-3. Similar results are shown in B) Ratio of SSEA-3 positive large cells to SSEA-3 positive small cells.

Similar articles

Cited by

References

    1. Adamo A, Barrero MJ, Belmonte JC. LSD1 and pluripotency: a new player in the network. Cell Cycle. 2011a;10:3215–3216. - PubMed
    1. Adamo A, Sese B, Boue S, Castano J, Paramonov I, Barrero MJ, Izpisua Belmonte JC. LSD1 regulates the balance between self-renewal and differentiation in human embryonic stem cells. Nature cell biology. 2011b;13:652–659. - PubMed
    1. Ahn SE, Kim S, Park KH, Moon SH, Lee HJ, Kim GJ, Lee YJ, Cha KY, Chung HM. Primary bone-derived cells induce osteogenic differentiation without exogenous factors in human embryonic stem cells. Biochem Biophys Res Commun. 2006;340:403–408. - PubMed
    1. Ali S, Buluwela L, Coombes RC. Antiestrogens and their therapeutic applications in breast cancer and other diseases. Annu Rev Med. 2011;62:217–232. - PubMed
    1. Allegrucci C, Wu YZ, Thurston A, Denning CN, Priddle H, Mummery CL, Ward-van Oostwaard D, Andrews PW, Stojkovic M, Smith N, Parkin T, Jones ME, Warren G, Yu L, Brena RM, Plass C, Young LE. Restriction landmark genome scanning identifies culture-induced DNA methylation instability in the human embryonic stem cell epigenome. Hum Mol Genet. 2007;16:1253–1268. - PubMed

Publication types

MeSH terms

Substances