. 2012 Oct;92(10):1451-60.
doi: 10.1038/labinvest.2012.110. Epub 2012 Aug 20.

Monoamine oxidase A expression is suppressed in human cholangiocarcinoma via coordinated epigenetic and IL-6-driven events

Affiliations

Monoamine oxidase A expression is suppressed in human cholangiocarcinoma via coordinated epigenetic and IL-6-driven events

Li Huang et al. Lab Invest. 2012 Oct.

Abstract

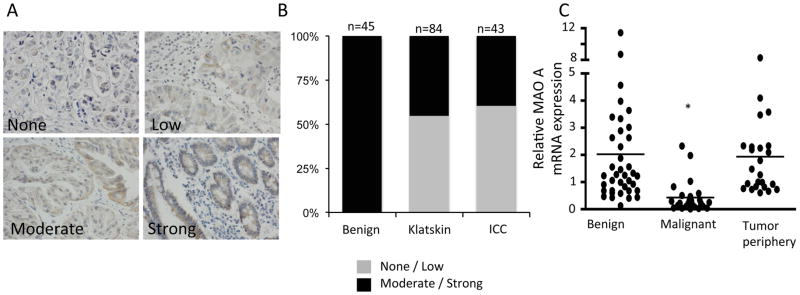
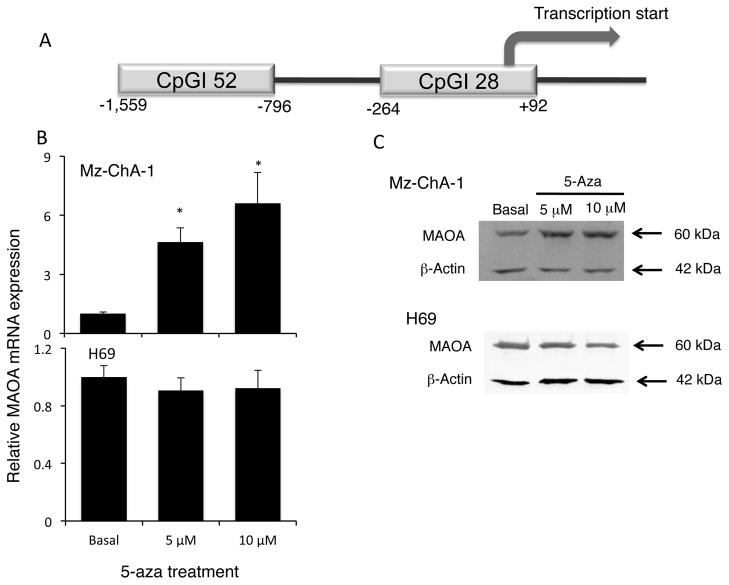
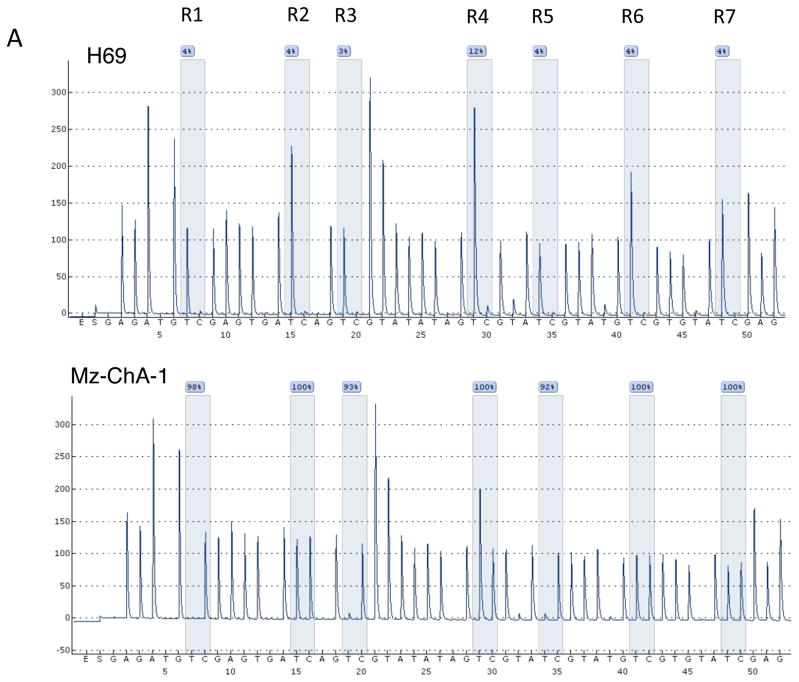
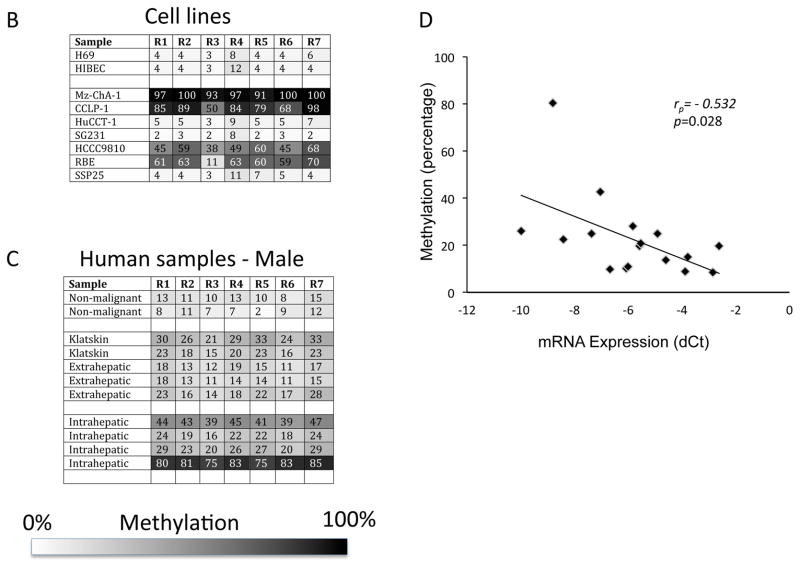
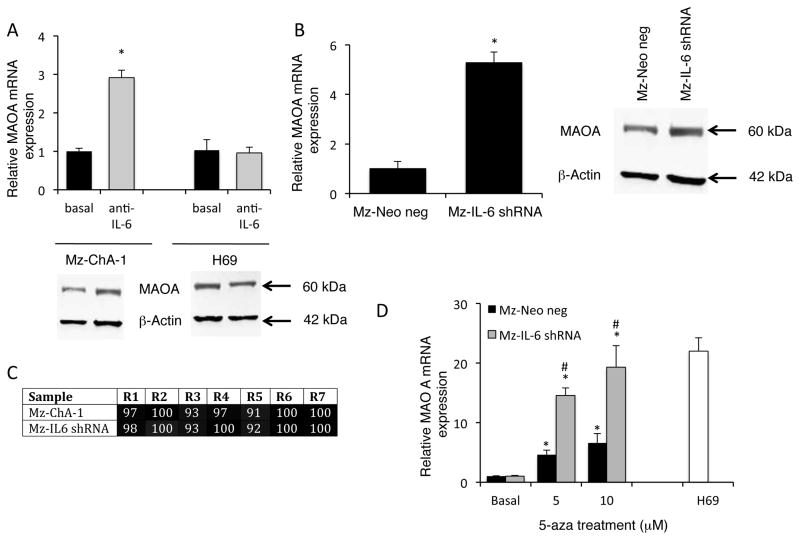
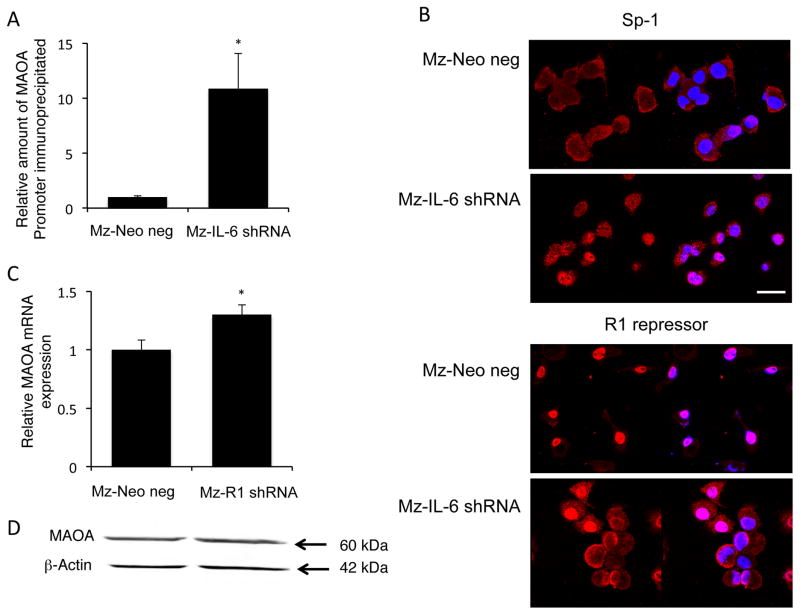
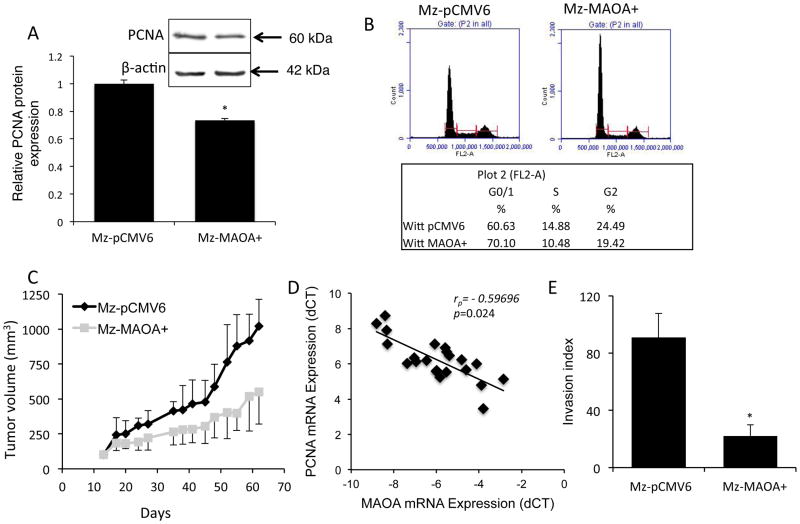
The secretion of dopamine and serotonin is increased in cholangiocarcinoma, which has growth-promoting effects. Monoamine oxidase A (MAOA), the degradation enzyme of serotonin and dopamine, is suppressed in cholangiocarcinoma via an unknown mechanism. The aims of this study were to (i) correlate MAOA immunoreactivity with pathophysiological parameters of cholangiocarcinoma, (ii) determine the mechanism by which MAOA expression is suppressed and (iii) evaluate the consequences of restored MAOA expression in cholangiocarcinoma. MAOA expression was assessed in cholangiocarcinoma and nonmalignant controls. The control of MAOA expression by promoter hypermethylation was evaluated and the contribution of interleukin-6 (IL-6) signaling to the suppression of MAOA expression was determined. The effects of MAOA overexpression on cholangiocarcinoma growth and invasion were also assessed. MAOA expression is correlated with differentiation, invasion and survival in cholangiocarcinoma. The MAOA promoter was hypermethylated immediately upstream of the start codon in cholangiocarcinoma samples and cell lines but not in nonmalignant counterparts. IL-6 signaling also decreased MAOA expression via a mechanism independent of hypermethylation, involving the regulation of the balance between SP-1 transcriptional activity and its inhibitor, R1 repressor. Inhibition of both IL-6 signaling and DNA methylation restored MAOA levels to those observed in cholangiocytes. Forced MAOA overexpression inhibited cholangiocarcinoma growth and invasion. MAOA expression is suppressed by the coordinated control of promoter hypermethylation and IL-6 signaling. MAOA may be a useful prognostic marker in the management of cholangiocarcinoma, and therapies designed to increase MAOA expression might prove beneficial in the treatment of cholangiocarcinoma.


Figures

Figure 1
Figure 1. MAOA immunoreactivity in cholangiocarcinoma
Surgically ressected samples from Klatskin and intrahepatic tumors were evaluated for MAOA immunoreactivity and categorized as either strong, moderate, low or none. Choledochal cysts were used as benign controls. (A) Representative photomicrographs of the MAOA staining in each category. (Magnification X40) (B) The proportion of the samples that were categorized as moderate to strong versus none to low for each tissue type is depicted. (C) In a subset of clinical samples, tumor tissue was microdissected from the tumor periphery. RNA was extracted and real time PCR for MAOA was performed. Data are expressed as average ± SD (n=4; *p<0.05). The survival rate of patients with moderate to strong MAOA immunoreactivity versus none to low immunoreactivity was assessed for Klatskin tumors (D) and intrahepatic cholangiocarcinoma (E).
Figure 2
Figure 2. MAOA promoter contains CpG Islands and MOA expression is regulated by hypermethylation
The published sequence of the human MAOA promoter was analyzed using the Emboss cpgplot software. Two putative CpG islands were found and are represented (A). Mz-ChA-1 and H69 cells were treated with various concentrations of 5-aza-2-deoxycytidine for 4 days. MAOA expression was assessed by realtime PCR (B) and immunoblotting (C). Real time PCR data are expressed as average ± SD (n=4). (* p<0.05). Representative MAOA immunoblots are shown. β-Actin was used as the loading control.
Figure 3
Figure 3. CpGI 28 of the MAOA promoter region is hypermethylated in cholangiocarcinoma
DNA was extracted from cell lines and human tissue and underwent bisulfite modification. Regions within the CpG islands were then amplified by PCR and the degree of methylation was assessed by pyrosequencing. Representative traces from the cholangiocyte cell line H69 and the cholangiocarcinoma cell line Mz-ChA-1 are shown (A) and the CpG residues within this sequence are designated R1 through R7. The degree to which each residue was hypermethylated for each cell line (B) or representative tumor tissue (C) was expressed on a grayscale. Average methylation for each sample was then correlated to the MAOA mRNA expression levels from each sample (D) and was significantly correlated (p=0.028) with a correlation co-efficient of r= −0.532.
Figure 4
Figure 4. MAOA expression is regulated by IL-6 signaling
Mz-ChA-1 and H69 cells were treated with an anti-IL-6 neutralizing antibody for 4 days. MAOA expression was assessed by real time PCR and immunoblotting in these treatment groups (A). In parallel, MAOA expression was assessed in cell lines stably expressing IL-6 shRNA (Mz-IL-6 shRNA) compared to the control cell line (Mz-Neo neg) by real time PCR and immunoblotting (B). The degree of promoter hypermethylation in Mz-IL-6 shRNA and Mz-Neo neg cells was assessed by pyrosequencing and expressed on a gray-scale (C). Mz-Neo neg and Mz-IL-6 shRNA cells were treated with 5-aza-2-deoxycytidine (5-aza) for 4 days and MAOA expression was assessed by real time PCR and compared to MAOA levels in H69 cells (D). Real time PCR data are expressed as average ± SD (n=4). (*p<0.05 compared basal-treated samples; #p<0.05 compared to the same treatment in the Mz-Neo neg cells). Representative MAOA immunoblots are shown andβ-Actin was used as the loading control.
Figure 5
Figure 5. IL-6 regulates the balance between SP-1 transciptional activity and R1 repressor
The relative amount of SP-1 transcription factor bound to the MAOA promoter was assessed in Mz-Neo neg and Mz-IL-6 shRNA cells by chromatin immunoprecipitation (A) using a specific SP-1 antibody to precipitate the complex followed by real time PCR using specific primers for the MAOA promoter region. The subcellular localization of SP-1 and R1 repressor in these cell lines was determined by immunofluorescence. SP-1 or R1 repressor immunoreactivity is shown in red, nuclei were counterstained with DAPI (blue; scale=20μm; B). A stable transfected cell line expressing R1 repressor shRNA (Mz-R1 shRNA) was used to assess the effects of R1 repressor on MAOA expression by real time PCR (C) and immunoblotting (D). Real time PCR data are expressed as average ± SD (n=4). (* p<0.05). Representative MAOA immunoblots are shown;β-Actin was used as the loading control.
Figure 6
Figure 6. Restoration of MAOA expression inhibits cholangiocyte proliferation
Proliferative capacity was assessed in a cell line overexpressing MAOA (Mz-MAOA+) compared to the control cell line (Mz-pCMV6) by immunoblotting for PCNA (A). Data are expressed as average ± SD (n=4) after normalization for loading with β-Actin. (*p<0.05 compared Mz-pCMV6 cells). Representative PCNA immunoblots are shown;β-Actin is shown as a loading control. Cell cycle progression was assessed by flow cytometry and the percentage of cells in the G0/G1, S and G2 phases determined (B). In vivo, Mz-MAOA+ and Mz-pCMV6 cells were injected into the flank of athymic mice. After tumors were established (12 days), tumor volume was measured for a further 50 days (n=6; C). In our human samples, PCNA mRNA expression for each sample was then correlated to the MAOA mRNA expression levels from each sample (D) and was significantly correlated (p=0.024) with a correlation co-efficient of r= −0.59696. The invasive capacity of Mz-pCMV6 and Mz-MAOA+ cells was assessed using a commercially available invasion assay. The invasion index was determined as the percentage of invading cells in the invasion chamber compared to the invading cells in the control chambers (E). Data are expressed as average ± SD (*p<0.05).

Similar articles

Cited by

References

    1. Alpini G, McGill JM, LaRusso NF. The pathobiology of biliary epithelia. Hepatology. 2002;35(5):1256–1268. - PubMed
    1. Sirica AE. Cholangiocarcinoma: molecular targeting strategies for chemoprevention and therapy. Hepatology. 2005;41(1):5–15. - PubMed
    1. Alpini G, Invernizzi P, Gaudio E, et al. Serotonin metabolism is dysregulated in cholangiocarcinoma, which has implications for tumor growth. Cancer research. 2008;68(22):9184–9193. - PMC - PubMed
    1. Coufal M, Invernizzi P, Gaudio E, et al. Increased local dopamine secretion has growth-promoting effects in cholangiocarcinoma. International journal of cancer Journal international du cancer. 2010;126(9):2112–2122. - PMC - PubMed
    1. Francis H, Demorrow S, Venter J, et al. Inhibition of histidine decarboxylase ablates the autocrine tumorigenic effects of histamine in human cholangiocarcinoma. Gut. 2011 - PMC - PubMed

Publication types

MeSH terms