. 2012 Nov 15;590(22):5877-93.
doi: 10.1113/jphysiol.2012.234476. Epub 2012 Aug 20.

Sustained NMDA receptor activation by spreading depolarizations can initiate excitotoxic injury in metabolically compromised neurons

Affiliations

Sustained NMDA receptor activation by spreading depolarizations can initiate excitotoxic injury in metabolically compromised neurons

Isamu Aiba et al. J Physiol. .

Abstract

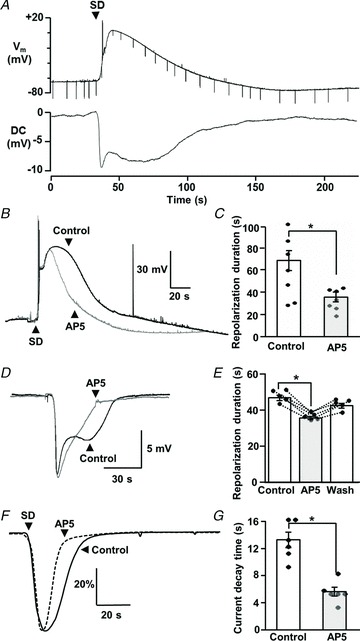
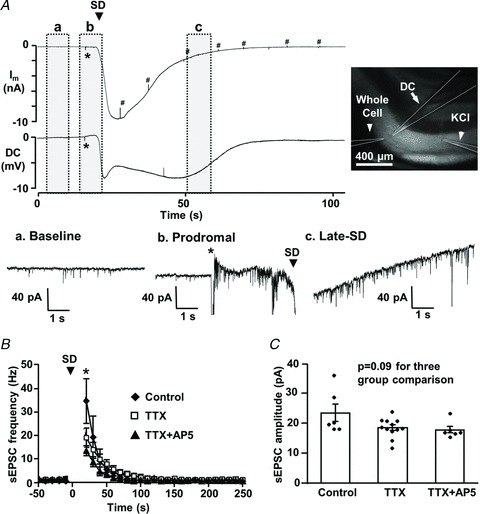
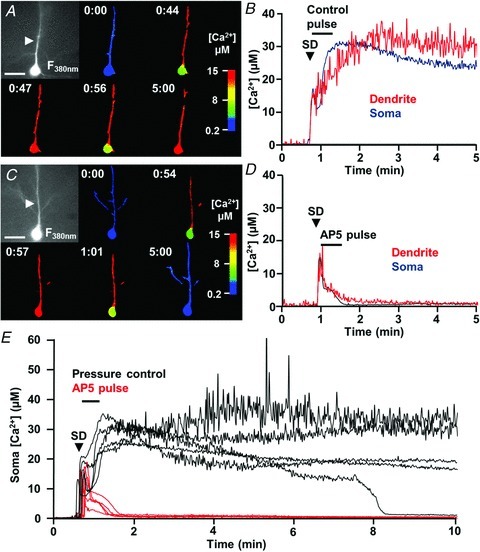
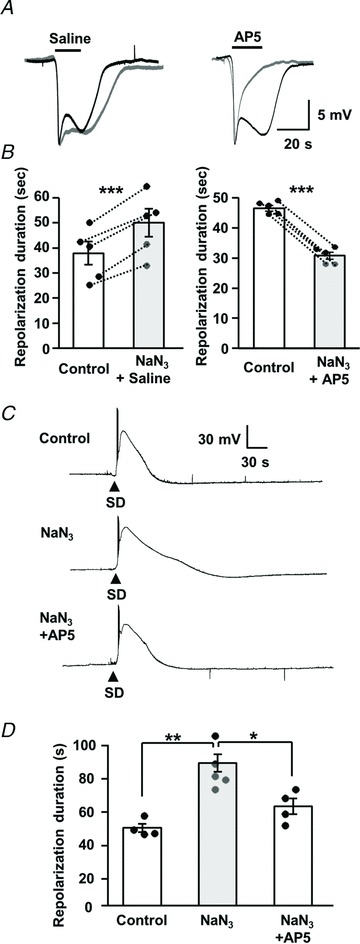
Spreading depolarizations (SDs) are slowly propagating waves of near-complete neuronal and glial depolarization. SDs have been recorded in patients with brain injury, and the incidence of SD significantly correlates with outcome severity. Although it is well accepted that the ionic dyshomeostasis of SD presents a severe metabolic burden, there is currently limited understanding of SD-induced injury processes at a cellular level. In the current study we characterized events accompanying SD in the hippocampal CA1 region of murine brain slices, using whole-cell recordings and single-cell Ca(2+) imaging. We identified an excitatory phase that persisted for approximately 2 min following SD onset, and accompanied with delayed dendritic ionic dyshomeostasis. The excitatory phase coincided with a significant increase in presynaptic glutamate release, evidenced by a transient increase in spontaneous EPSC frequency and paired-pulse depression of evoked EPSCs. Activation of NMDA receptors (NMDARs) during this late excitatory phase contributed to the duration of individual neuronal depolarizations and delayed recovery of extracellular slow potential changes. Selectively targeting the NMDAR activation following SD onset (by delayed pressure application of a competitive NMDAR antagonist) significantly decreased the duration of cellular depolarizations. Recovery of dendritic Ca(2+) elevations following SD were also sensitive to delayed NMDA antagonist application. Partial inhibition of neuronal energy metabolism converted SD into an irrecoverable event with persistent Ca(2+) overload and membrane compromise. Delayed NMDAR block was sufficient to prevent these acute injurious events in metabolically compromised neurons. These results identify a significant contribution of a late component of SD that could underlie neuronal injury in pathological circumstances.


Figures

Figure 3
Figure 3. Increased release probability during the late-spreading depolarization (SD) phase as assessed from paired-pulse ratios (PPR)
A, representative trace of voltage-clamp recording during SD. Whole-cell current was recorded at −50 mV with bipolar stimulation of Shaffer-collaterals. Paired stimulation (100 ms interpulse interval) was delivered at 0.2 Hz, and evoked EPSCs appear as sharp vertical lines and are expanded in the insets (ac). Note the reversed PPR and slow EPSC kinetics during the late-SD phase (b). B, quantitative analysis of PPR changes in control conditions (n= 8) and in the presence of dl-AP5 (20 μm, 10 min, n= 8). Data during the late-SD phase were collected from the initial three–five responses. dl-AP5 did not show any significant effects on PPR throughout the recordings. C, representative traces showing membrane responses to test pulses (−10 mV, 200 ms), and the waveform of single evoked EPSCs during baseline and in the late-SD phase. Note that the membrane response to the test pulse shows almost full recovery. On the other hand, kinetics of evoked EPSC was significantly slowed in the late-SD phase (see Results). sEPSCs occurring during the late-SD phase are indicated by arrowheads.
Figure 1
Figure 1. NMDAR activation contributes to prolonged dendritic Ca2+ loading after spreading depolarization (SD)
AC, intracellular Ca2+ dynamics during SD monitored in single neurons loaded with Fura-6F in control conditions (n= 8). SD was generated by local microinjection of KCl (>200 μm from recorded neurons) and Fura-6F ratios were determined at 1 Hz. A, raw image of Fura-6F fluorescence (380 nm excitation, left panel, scale bar: 20 μm) and selected pseudo-coloured images representing intracellular Ca2+ levels at times indicated in minutes. Calculated Ca2+ concentrations from this neuron are shown in B (soma values in blue, dendrite values determined from region indicated by arrows are in red). C, mean data from eight such control experiments. DF, as described above, except that slices were pre-exposed to 20 μm dl-AP5 for 10 min prior to SD (n= 7 for F). Note the rapid recovery of dendritic Ca2+ levels in AP5, despite the similar initial Ca2+ loading in soma and dendritic compartments.
Figure 4
Figure 4. NMDAR antagonism accelerated repolarization and current decay of spreading depolarization (SD)
A, simultaneous recording of membrane potential (Vm) and extracellular DC potential changes associated with SD, demonstrating the extended neuronal depolarization during the late-SD phase. Test current pulses (−200 pA, 500 ms, downward deflections in Vm) were applied periodically throughout the recordings to monitor seal quality and assess input resistance changes. B, example traces from a single neuron, showing membrane depolarizations during a control SD and then during a second SD generated in dl-AP5 (20 μm, 10 min exposure, 20 min interval between SDs). dl-AP5 significantly decreased the duration of depolarization, and this effect was completely reversed following dl-AP5 washout in recordings from this neuron. C, mean data from similar experiments where the effects of dl-AP5 were tested in separate populations of control and AP5-treated preparations. Mean durations of 10–90% repolarization are presented (data pooled to give a total of seven recordings for each bar; two where repetitive SDs could be recorded from single neurons, and five from single SDs in each condition, *P < 0.05). D, example traces from a single slice, showing extracellular DC potential changes during a control SD and then during a second SD generated in dl-AP5 (20 μm, 10 min exposure, 20 min interval between SDs). E, mean data from five such experiments and showing reversibility after dl-AP5 washout. Duration was determined from the time to 70% recovery from the initial peak. *P < 0.05. F, dl-AP5 (20 μm, 10 min) also decreased the duration of large inward current during SD. SD currents were normalized to peak responses, and average waveforms from control (continuous line, n= 6) and dl-AP5 (dashed line, n= 6) are shown. Data were pooled to give a total of six recordings for each trace; three where repetitive SDs could be recorded from single neurons, and three from single SDs in each condition). G, mean data showing the time to 50% recovery from peak currents, in the population of neurons shown in F. *P < 0.05
Figure 2
Figure 2. Increased spontaneous (s)EPSC frequency following the initial depolarization of spreading depolarization (SD)
A, representative traces of simultaneous whole-cell current (Im: voltage-clamped at −50 mV) and extracellular DC potential recordings. SD was generated by local microinjection of KCl (> 200 μm from recording site, application time indicated by *), and was recorded from single pyramidal neuron and corresponding dendritic field. The image shows locations of the whole-cell patch pipette, extracellular DC recording electrode and KCl ejection pipette (highlighted by dashed lines). Traces in a–c show recordings from baseline (a), prodromal (b) and late-SD (c) phases of the whole-cell current at an expanded time base to show increases in sEPSC frequency associated with SD. Membrane responses to test pulses are marked by #. B, plot showing mean increases in sEPSC frequency associated with SD. In control conditions (closed diamonds, n= 6), sEPSC frequency to >30 Hz, and slowly recovered over the subsequent minute. Time was adjusted to the onset of SD (t= 0, indicated by arrowhead) and mean sEPSC frequency is shown in 10-s bins. sEPSC frequencies during the first 20 s after SD onset were excluded, because the quality of voltage-clamp could not be verified during the initial phase of the large SD current. TTX (open squares, n= 12) significantly reduced sEPSC frequency at time points indicated by asterisks (P < 0.05 compared with controls), but co-application of dl-AP5 did not further affect sEPSC frequency (closed triangles, n= 6, P >0.20). C, sEPSC mean amplitudes were not significantly altered when tested at the first time point shown after SD (asterisk in B).
Figure 5
Figure 5. NMDAR activation during the late-spreading depolarization (SD) period underlies prolonged ionic loads
AC, delayed pressure application of dl-AP5 (after the passage of SD) significantly decreased the duration of extracellular DC potentials. A, time control showing that the duration of DC shifts was reproducible when repetitive SDs were generated in a single slice. Localized pressure application of vehicle (0.1% DMSO, during time indicated by horizontal bar) during the second SD (grey trace) did not cause any reduction on DC response compared with the initial SD (black trace). B, in contrast, delayed dl-AP5 application significantly decreased the duration of the DC shift (grey trace), compared with the initial control response in the same slice (black trace). C, Mean data from five such vehicle and AP5 studies (**P < 0.01) DF, delayed NMDAR block prevented prolonged dendritic Ca2+ loading after SD. D, raw image of Fura-6F fluorescence (380 nm excitation, left panel, scale bar: 20 μm) and selected pseudo-coloured images representing intracellular Ca2+ levels at times indicated in minutes. Calculated Ca2+ concentrations from this neuron are shown in E (soma values in blue, dendrite values determined from region indicated by arrows are in red). F, mean data from five such experiments. Horizontal bars indicate the duration of localized dl-AP5 applications.
Figure 6
Figure 6. Prolonged NMDAR activation contributes to neuronal injury in metabolically compromised neurons
Energy metabolism of single neurons was partially inhibited by brief dialysis with sodium azide-containing internal solution, and Ca2+ responses during spreading depolarization (SD) were then evaluated. A, raw image of Fura-6F fluorescence (380 nm excitation, left panel, scale bar: 20 μm) and selected pseudo-coloured images representing intracellular Ca2+ levels at times indicated in minutes. Calculated Ca2+ concentrations from this neuron are shown in B (soma values in blue, dendrite values determined from region indicated by arrows are in red). Note that even though there was an initial transient recovery of somatic Ca2+ responses after the initial peak, sustained Ca2+ deregulation rapidly developed throughout the neuron after SD. C and D, same as described above for A and B, with the exception that dl-AP5 was applied locally to this selectively vulnerable neuron after the passage of SD. Note the prompt recovery of Ca2+ levels throughout the neuron. E, population data from control (black traces, n= 5) and dl-AP5-treated preparations (red traces, n= 5), showing the effectiveness of delayed dl-AP5 applications on neuronal Ca2+ overload, measured in somatic compartments of sodium azide-loaded neurons. Arrowhead indicates SD onset and the horizontal bar indicates the duration of vehicle (ACSF) or dl-AP5 pressure pulse applications.
Figure 7
Figure 7. Prolonged NMDAR activation triggered significant membrane compromise in metabolically stressed neurons
Single neurons were loaded with 0.2% Lucifer Yellow (LY) in sodium azide-containing internal solution, prior to spreading depolarization (SD) challenge. These neurons showed profound loss of intracellular LY following SD (A), but such loss was almost completely prevented by delayed dl-AP5 application (B). Localized dl-AP5 applications were as described above in Figs 5 and 6. A and B show representative fluorescence images from single neurons. C shows mean indicator loss measured 10 min after SD. Responses of four control neurons (white bar) are compared with four neurons that were protected with delayed dl-AP5 pulses, and then subjected to a second SD after dl-AP5 washout (grey bars, **P < 0.01 vs. control).
Figure 8
Figure 8. NMDAR activation contributes to extended depolarization of spreading depolarization (SD) in energy-depleted preparations
A and B, effects on extracellular DC potential shifts. A, in each panel, a pair of SDs was generated in a single slice. The first SD was without drug applications (black trace), and the second was in the presence of sodium azide (1 mm, 5 min pre-exposure, grey trace) and also included localized pressure application of either saline (left panels) or dl-AP5 (right panels, applications indicated by horizontal bars). B, mean data from five sets of each experiment shown in A, with DC durations measured at 70% recovery ***P < 0.005, paired t test. C and D, effects on single-cell depolarizations. C, representative traces under control conditions (top), in a neuron dialysed with sodium azide (middle; 300 μm, NaN3 in intracellular solution lacking ATP) and in an azide-loaded neuron with dl-AP5 bath application (bottom; 20 μm, 10 min exposure). Responses in each panel are from different preparations, recorded in consecutive experiments. D, mean durations of neuronal depolarization (10–90% repolarization) from experiments shown in C. The duration of neuronal depolarization was significantly extended by sodium azide dialysis (n= 5) compared with control (n= 4), and the effect was reversed by dl-AP5 (n= 4). *P < 0.01, *P < 0.05, one-way ANOVA with post hoc Turkey's multiple comparison test.

References

    1. Aiba I, Carlson AP, Sheline CT, Shuttleworth CW. Synaptic release and extracellular actions of Zn2+ limit propagation of spreading depression and related events in vitro and in vivo. J Neurophysiol. 2012;107:1032–1041. - PMC - PubMed
    1. Anderson TR, Andrew RD. Spreading depression: imaging and blockade in the rat neocortical brain slice. J Neurophysiol. 2002;88:2713–2725. - PubMed
    1. Blatow M, Caputi A, Burnashev N, Monyer H, Rozov A. Ca2+ buffer saturation underlies paired pulse facilitation in calbindin-D28k-containing terminals. Neuron. 2003;38:79–88. - PubMed
    1. Canals S, Makarova I, Lopez-Aguado L, Largo C, Ibarz JM, Herreras O. Longitudinal depolarization gradients along the somatodendritic axis of CA1 pyramidal cells: a novel feature of spreading depression. J Neurophysiol. 2005;94:943–951. - PubMed
    1. Connor JA, Cormier RJ. Cumulative effects of glutamate microstimulation on Ca2+ responses of CA1 hippocampal pyramidal neurons in slice. J Neurophysiol. 2000;83:90–98. - PubMed

Publication types

MeSH terms

LinkOut - more resources