. 2012 Dec 1;21(23):5019-38.
doi: 10.1093/hmg/dds343. Epub 2012 Aug 19.

The 5-phosphatase OCRL mediates retrograde transport of the mannose 6-phosphate receptor by regulating a Rac1-cofilin signalling module

Affiliations

The 5-phosphatase OCRL mediates retrograde transport of the mannose 6-phosphate receptor by regulating a Rac1-cofilin signalling module

Vanessa A van Rahden et al. Hum Mol Genet. .

Abstract

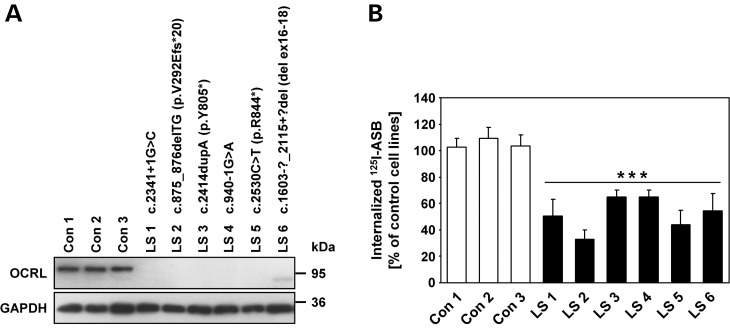
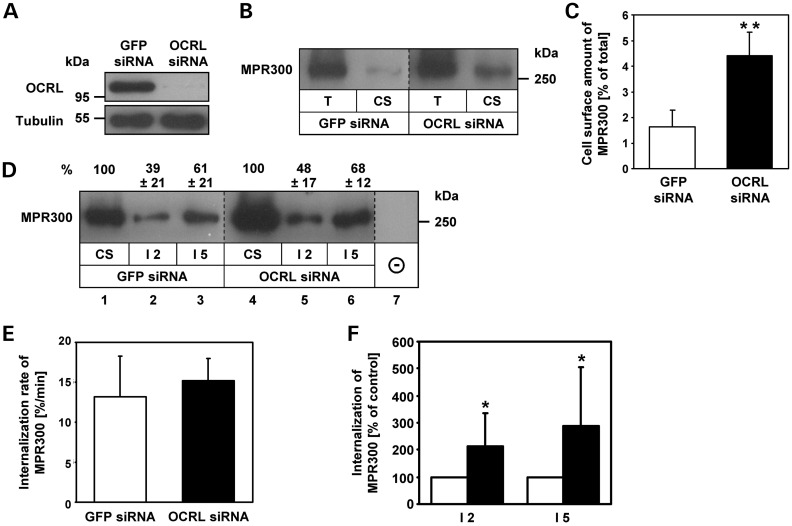
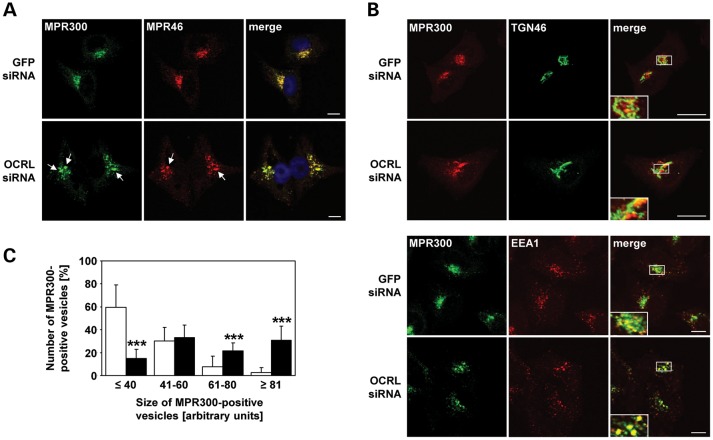
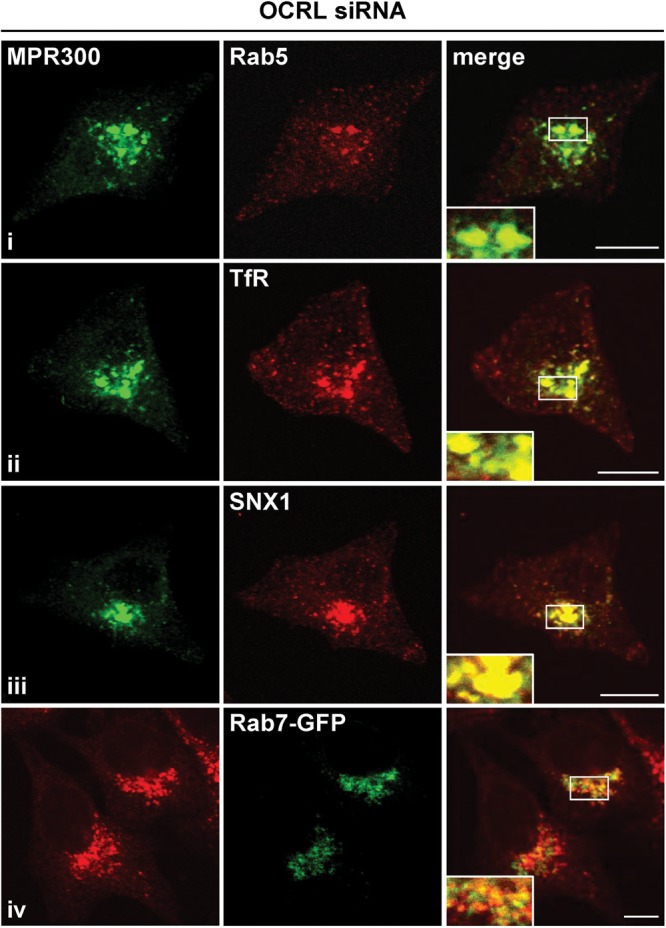
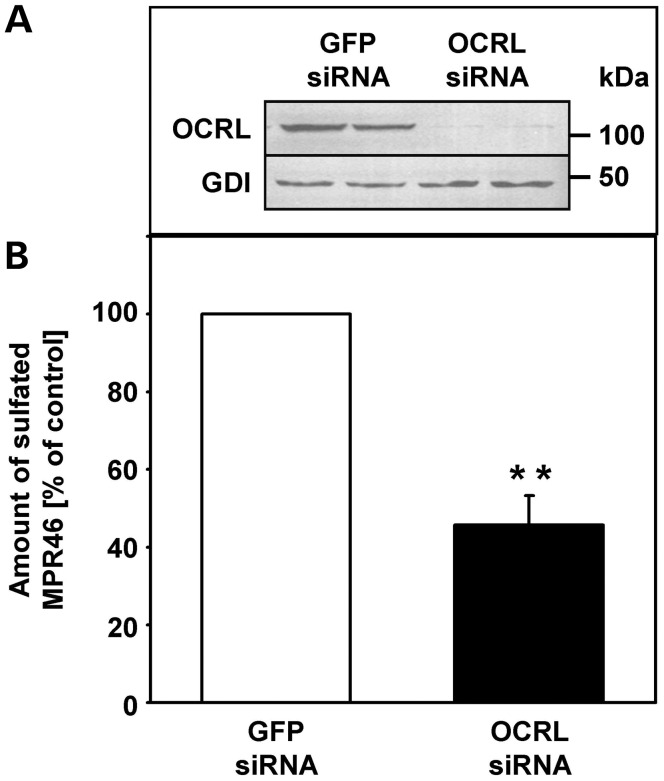
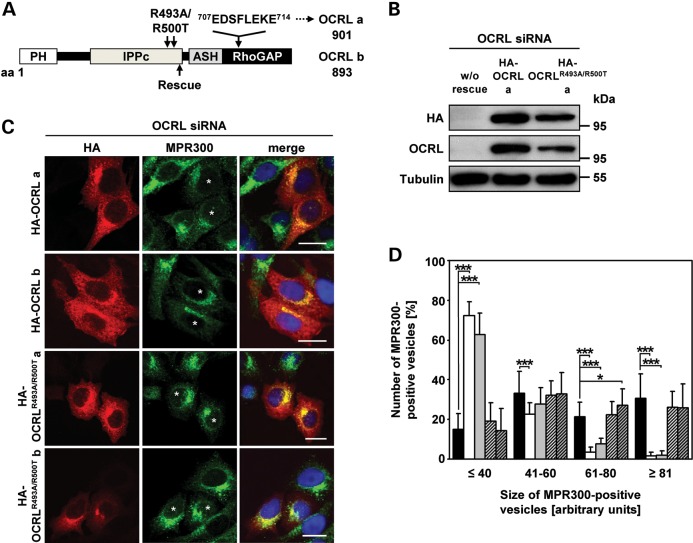
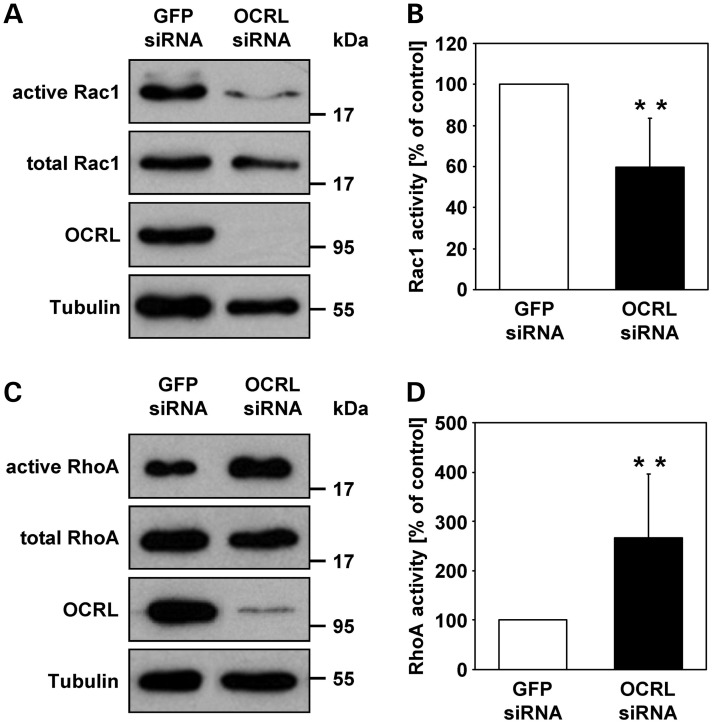
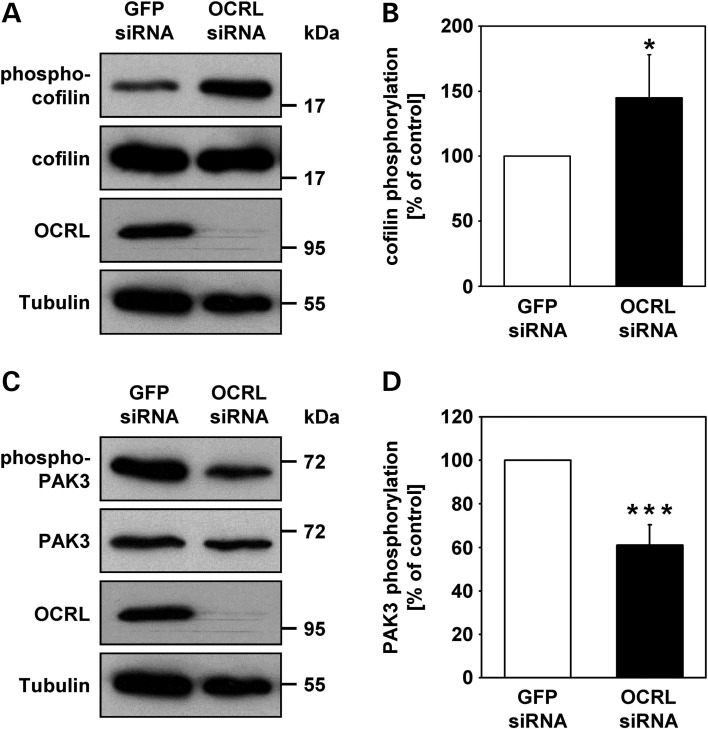
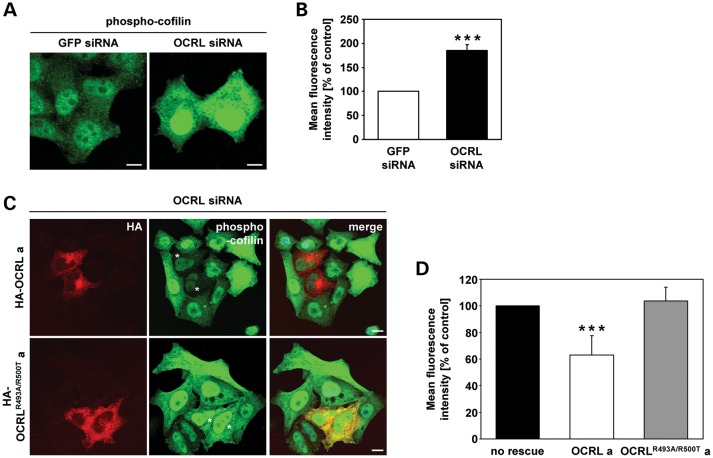
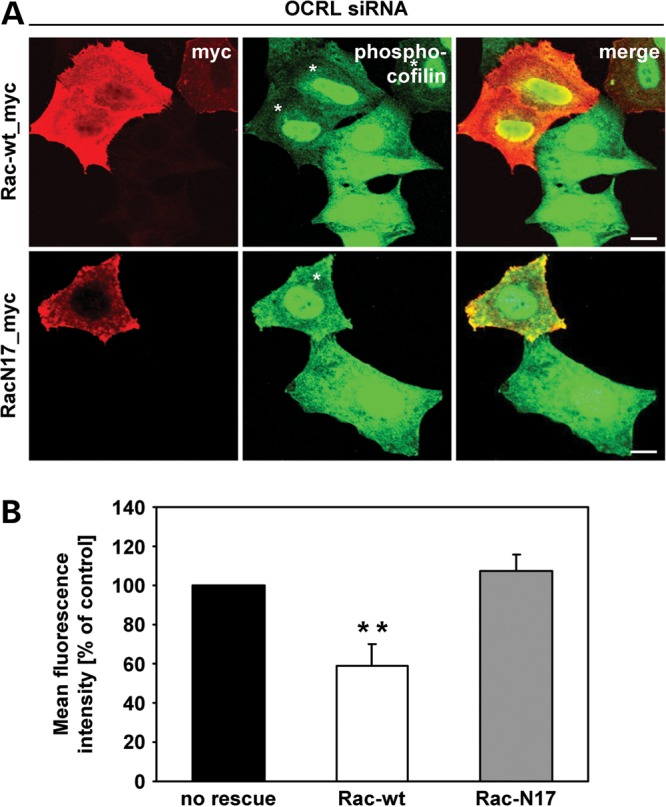
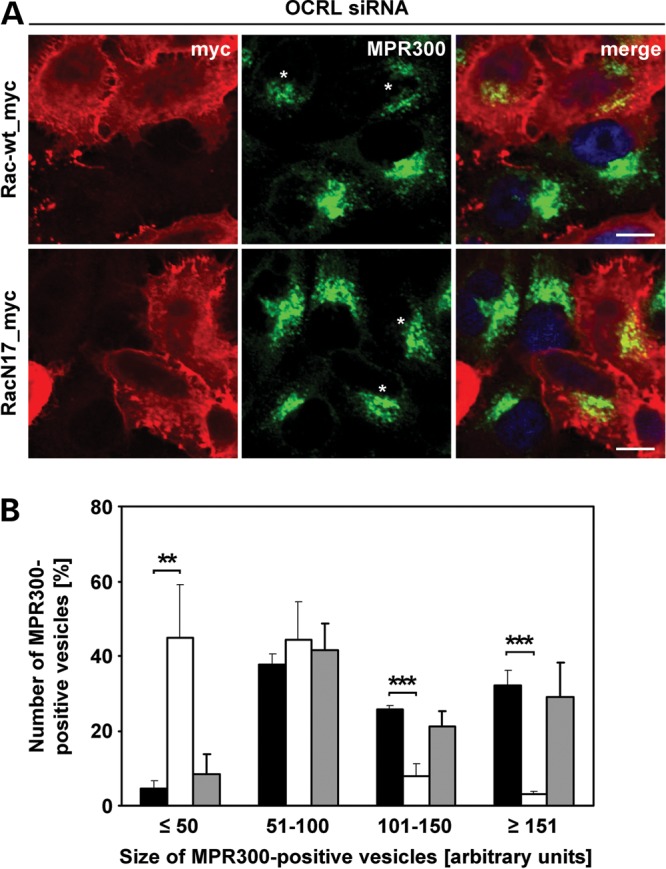
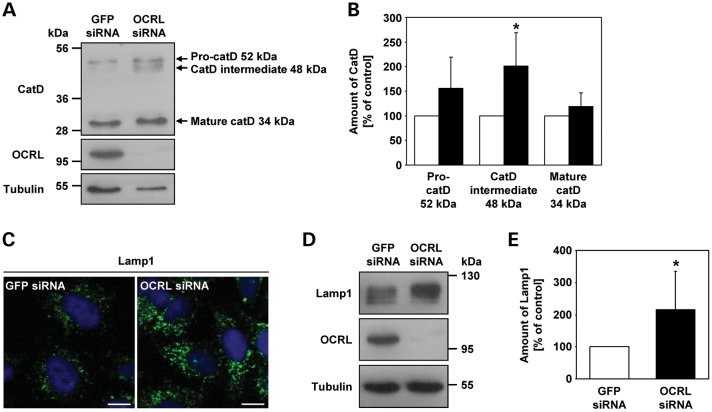
Mutations in the OCRL gene encoding the phosphatidylinositol 4,5-bisphosphate (PI(4,5)P(2)) 5-phosphatase OCRL cause Lowe syndrome (LS), which is characterized by intellectual disability, cataracts and selective proximal tubulopathy. OCRL localizes membrane-bound compartments and is implicated in intracellular transport. Comprehensive analysis of clathrin-mediated endocytosis in fibroblasts of patients with LS did not reveal any difference in trafficking of epidermal growth factor, low density lipoprotein or transferrin, compared with normal fibroblasts. However, LS fibroblasts displayed reduced mannose 6-phosphate receptor (MPR)-mediated re-uptake of the lysosomal enzyme arylsulfatase B. In addition, endosome-to-trans Golgi network (TGN) transport of MPRs was decreased significantly, leading to higher levels of cell surface MPRs and their enrichment in enlarged, retromer-positive endosomes in OCRL-depleted HeLa cells. In line with the higher steady-state concentration of MPRs in the endosomal compartment in equilibrium with the cell surface, anterograde transport of the lysosomal enzyme, cathepsin D was impaired. Wild-type OCRL counteracted accumulation of MPR in endosomes in an activity-dependent manner, suggesting that PI(4,5)P(2) modulates the activity state of proteins regulated by this phosphoinositide. Indeed, we detected an increased amount of the inactive, phosphorylated form of cofilin and lower levels of the active form of PAK3 upon OCRL depletion. Levels of active Rac1 and RhoA were reduced or enhanced, respectively. Overexpression of Rac1 rescued both enhanced levels of phosphorylated cofilin and MPR accumulation in enlarged endosomes. Our data suggest that PI(4,5)P(2) dephosphorylation through OCRL regulates a Rac1-cofilin signalling cascade implicated in MPR trafficking from endosomes to the TGN.


Figures

Figure 1.
Figure 1.
Dermal skin fibroblasts from patients with LS show reduced internalization of the lysosomal enzyme ASB. (A) Cell lysates of dermal skin fibroblasts from six patients with LS (LS 1 to LS 6) and three healthy individuals (Con 1 to Con 3) were subjected to SDS–PAGE, and immunoblotting with an anti-OCRL antibody was performed. Equal protein loading was confirmed by probing with an anti-GAPDH antibody. OCRL mutations in patients LS 1 to LS 6 were identified by routine genetic testing in our lab and are indicated for each cell line. (B) Control and LS fibroblasts were incubated with [125I]ASB for 3h as described in Materials and Methods. Intracellular radioactivity was determined in a γ-counter and normalized to the protein content. The amount of internalized [125I]ASB in LS fibroblasts is expressed as percentage of control cells. Each bar is the mean ± SD of at least five independent experiments. ***P < 0.001 (two-tailed Student's t-test).
Figure 2.
Figure 2.
OCRL-depleted HeLa cells exhibit an increased plasma membrane level and internalization of MPR300. (A) HeLa cells were treated with OCRL-specific siRNAs for 72 h. GFP-specific siRNA was used as a control. Depletion was monitored by immunoblotting with an anti-OCRL antibody, and an anti-tubulin antibody was used as loading control. The blot shows a representative result obtained upon depletion with one of three different OCRL-specific siRNAs applied in this work. Depletion efficiency of all siRNAs was comparable with >90% of OCRL depleted after 72 h. (B) GFP and OCRL siRNA-treated cells were biotinylated at 4°C and subjected to streptavidin agarose as described in Materials and Methods. Aliquots of total cell lysates (2%; T) and precipitated cell surface proteins (20%; CS) were analysed by MPR300 immunoblotting. A representative immunoblot of four independent experiments is shown. (C) Levels of MPR300 were quantified by scanning densitometry, and cell surface MPR300 was normalized to total MPR300. Each bar is the mean ± SD of four independent experiments. **P = 0.003 (two-tailed Student's t-test). To exclude off-target effects, three different siRNAs against OCRL were independently applied. (DF) GFP and OCRL siRNA-treated cells were biotinylated at 4°C and either harvested (CS) or incubated for 2 (I2) or 5 (I5) min at 37°C. Remaining biotin at the cell surface was removed using glutathione washes at 4°C, and the internalized biotinylated proteins were precipitated with streptavidin agarose followed by MPR300 immunoblotting. Levels of MPR300 were quantified by scanning densitometry and normalized to total MPR300. (D) A representative immunoblot is shown. Internalized MPR300 is expressed as percentage of cell surface MPR300 ± SD of six independent experiments. (E) Internalization rates were calculated as percentage of biotinylated cell surface receptors which are internalized per minute. Each bar is the mean ± SD of six independent experiments. (F) Internalized MPR300 in OCRL-depleted cells is expressed as percentage of control cells (white square GFP siRNA, black square OCRL siRNA). Each bar is the mean ± SD of at least six independent experiments. I2 (incubation for 2 min at 37°C): *P = 0.04; I5 (incubation for 5 min at 37°C): *P = 0.02 (two-tailed Student's t-test).
Figure 3.
Figure 3.
MPR46 and MPR300 colocalize in enlarged endosomal vesicles in the perinuclear region in OCRL-depleted cells. (AC) HeLa cells were treated with OCRL- or GFP-specific siRNA for 72 h, labelled with antibodies (see below) and analyzed by confocal laser scanning microscopy. (A) RNAi-treated HeLa cells were stained with an anti-MPR300 antibody, followed by an AlexaFluor488-conjugated secondary antibody (green), and an anti-MPR46 antibody, followed by an AlexaFluor546-conjugated secondary antibody (red). Co-localization of the two MPRs is shown on the merged images. The nucleus was visualized with DAPI (blue). Arrows point to enlarged MPR-positive vesicles. Scale bar = 10 µm. To exclude off-target effects, three different siRNAs against OCRL were independently applied. (B) RNAi-treated HeLa cells were stained with an anti-MPR300 antibody, followed by an AlexaFluor488- (green) or AlexaFluor546- (red) conjugated secondary antibody, and an anti-TGN46 antibody, followed by an AlexaFluor488-conjugated secondary antibody (green) or an anti-EEA1 antibody, followed by an AlexaFluor546-conjugated antibody (red). Co-localization is shown on the merged images. Scale bar = 10 µm. (C) Quantification of MPR300-positive vesicles of various sizes was performed by the Metamorph software. To enable direct comparison, all images were taken under the same magnification and laser intensity settings. Sizes of MPR300-positive structures are given in arbitrary units (AU). The number of MPR300-decorated vesicles per AU (≤40, 41–60, 61–80 and ≥81) is given as percentage of the number of vesicles counted in total. Results are from three independent experiments with a total of 20 cells per condition counted, and are shown as the mean ± SD (white square GFP siRNA, black square OCRL siRNA). ***P < 0.001 (two-tailed Student's t-test).
Figure 4.
Figure 4.
MPR300 localizes in enlarged retromer-positive early endosomes in OCRL-depleted cells. OCRL-depleted cells were labelled with an anti-MPR300 antibody [followed by an AlexaFluor488-conjugated secondary antibody (green in i–iii) or an AlexaFluor546-conjugated secondary antibody (red in iv)] and an anti-Rab5 (i, early endosome), anti-TfR (ii, early and recycling endosome) or anti-SNX1 antibody (iii, component of retromer complex), followed by an AlexaFluor546-conjugated antibody (red). To label the late endosomal compartment, OCRL-depleted cells were transfected with a construct expressing Rab7-GFP (iv, green). Co-localization is shown on the merged images. Scale bar = 10 µm.
Figure 5.
Figure 5.
Endosome-to-TGN transport of MPR46 is impaired in OCRL-depleted HeLa cells. (A) HEK-293 cells stably expressing HMY-MPR46 were treated with OCRL- or GFP-specific siRNA for 72 h and cultivated in sulfate-free media containing chlorate. Depletion was monitored by immunoblotting with an anti-OCRL antibody, and an anti-guanine nucleotide dissociation inhibitor (GDI) antibody was used as loading control. (B) Cyclohexamide was added to the sulfate-free media containing chlorate prior to the experiment. Chlorate was substituted by [35S]sulfate to measure retrograde transport of MPR46 to the TGN. The amount of sulfated MPR46 was determined by Ni-NTA precipitation and scintillation counting and was normalized to the protein content. For more details, see the Materials and Methods section. The amount of sulfated MPR46 in OCRL-depleted cells is expressed as percentage of control cells. Each bar is the mean ± SD of two independent experiments, each performed in duplicate. **P = 0.01 (two-tailed Student's t-test).
Figure 6.
Figure 6.
The 5-phosphatase activity of OCRL is required for proper localization of MPR300. (A) Schematic view of the OCRL domain structure of isoforms a and b. The position of the siRNA-resistant rescue sequence is indicated by an arrow below the domain structure. The eight additional amino acids encoded by exon 18a in isoform a and amino acid substitutions for producing the 5-phosphatase-inactive OCRL variants are indicated above the domain structure. The first and last amino acid residues of OCRL isoforms a and b are given. PH, pleckstrin homology; IPPc, inositol polyphosphate phosphatase, catalytic; ASH, ASPM, SPD-2, hydin; RhoGAP, Rho GTPase activating protein. (BD) HeLa cells were treated with siRNA against OCRL for 72 h, followed by transfection with siRNA-resistant constructs expressing HA-tagged wild-type OCRL isoform a or b (HA-OCRL a, HA-OCRL b) or 5-phosphatase-inactive OCRL isoform a or b (HA-OCRLR493A/R500T a, HA-OCRLR493A/R500T b), prior to cell lysis or fixation for immunofluorescence analysis. (B) After cell lysis, siRNA-resistant OCRL variants were detected by immunoblotting using an anti-HA-HRP antibody. Depletion was monitored by immunoblotting with an anti-OCRL antibody, and an anti-tubulin antibody was used as loading control. The blot shows a representative result obtained upon expression of wild-type and 5-phosphatase-deficient OCRL isoform a. The same results were obtained after expression of both OCRL isoform b variants (data not shown). (C) siRNA-resistant OCRL variants were detected by staining cells with an anti-HA antibody, followed by an AlexaFluor546-conjugated secondary antibody (red). MPR300 localization was visualized by using an anti-MPR300 antibody, followed by an AlexaFluor488-conjugated secondary antibody (green). * indicates cells transfected with an siRNA-resistant OCRL construct. The nucleus was visualized using DAPI (blue). Scale bar = 20 µm. (D) Quantification of MPR300-positive vesicles of various sizes was performed by the Metamorph software. To enable direct comparison, all images were taken under the same magnification and laser intensity settings. Sizes of MPR300-positive structures are given in arbitrary units (AU). The number of MPR300-positive vesicles per AU (≤40, 41–60, 61–80 and ≥81) is given as percentage of the number of vesicles counted in total. Results are from three independent experiments with a total of 20 cells per condition counted and are shown as the mean ± SD (black square OCRL siRNA, white square OCRL siRNA+HA-OCRL a, gray square OCRL siRNA+HA-OCRL b, square with cross lines OCRL siRNA+HA-OCRLR493A/R500T, a shaded square with cross lines OCRL siRNA+HA-OCRLR493A/R500T b). *P = 0.025; ***P < 0.001 (two-tailed Student's t-test).
Figure 7.
Figure 7.
The activation status of the RhoGTPases Rac1 and RhoA is altered upon OCRL depletion in HeLa cells. (A) RNAi-treated HeLa cells were harvested and GTP-bound Rac1 was pulled down from protein lysates using the GST-PAK[PBD] fusion protein as described in Materials and Methods. Precipitated (active) and total amounts (active and inactive) of Rac1 were detected by immunoblotting using an anti-Rac1 antibody (representative immunoblots—two top panels). OCRL depletion was monitored with an anti-OCRL antibody, and an anti-tubulin antibody was used as loading control (two lower panels). (B) Activity levels of Rac1 were determined by scanning densitometry and normalization of active Rac1 to total Rac1. Rac1 activity in OCRL-depleted cells is expressed as percentage of control cells. Each bar is the mean ± SD of six independent experiments. **P = 0.002 (two-tailed Student's t-test). To exclude off-target effects, three different siRNAs against OCRL were independently applied. (C) RNAi-treated HeLa cells were stimulated with 0.1 mg/ml calpeptin for 40 min, harvested and GTP-bound RhoA was pulled down from protein lysates using GST-Rhotekin[RBD]. Precipitated (active) and total amounts (active and inactive) of RhoA were detected by immunoblotting using an anti-RhoA antibody (representative immunoblots—two top panels). OCRL depletion was monitored with an anti-OCRL antibody, and an anti-tubulin antibody was used as loading control (two lower panels). (D) Activity levels of RhoA were determined by scanning densitometry and normalization of active RhoA to total RhoA. RhoA activity in OCRL-depleted cells is expressed as percentage of control cells. Each bar is the mean ± SD of seven independent experiments. **P = 0.005 (two-tailed Student's t-test). To exclude off-target effects, three different siRNAs against OCRL were independently applied.
Figure 8.
Figure 8.
OCRL depletion in HeLa cells leads to enhanced phosphorylation of cofilin, while phosphorylation of PAK3 is diminished. (A) HeLa cells were treated with OCRL- or GFP-specific siRNA, stimulated with 10 ng/ml EGF for 20 min, harvested and analysed by immunoblotting using an anti-phospho-cofilin or an anti-cofilin antibody (representative immunoblots—two upper panels). OCRL depletion was monitored with an anti-OCRL antibody, and an anti-tubulin antibody was used as loading control (two lower panels). (B) The phosphorylation state of cofilin was determined by scanning densitometry and normalization of phospho-cofilin to total cofilin. The phosphorylation level of cofilin in OCRL-depleted cells is expressed as percentage of control cells. Each bar is the mean ± SD of five independent experiments. *P = 0.02 (two-tailed Student's t-test). To exclude off-target effects, three different siRNAs against OCRL were independently applied. (C) RNAi-treated HeLa cells were stimulated with 10 ng/ml EGF for 20 min, harvested and analyzed by immunoblotting using an anti-phospho-PAK3 or an anti-PAK3 antibody (representative immunoblots—two upper panels). OCRL depletion was monitored with an anti-OCRL antibody, and an anti-tubulin antibody was used as loading control (two lower panels). (D) The phosphorylation state of PAK3 was determined by scanning densitometry and normalization of phosphorylated PAK3 to total PAK3. The phosphorylation level of PAK3 in OCRL-depleted cells is expressed as percentage of control cells. Each bar is the mean ± SD of six independent experiments. ***P < 0.001 (two-tailed Student's t-test). To exclude off-target effects, three different siRNAs against OCRL were independently applied.
Figure 9.
Figure 9.
OCRL's 5-phosphatase activity regulates phosphorylation of cofilin. (A) HeLa cells were transfected with OCRL- or GFP-specific siRNA, stimulated with 10 ng/ml EGF for 20 min, fixed and analyzed by confocal laser scanning microscopy. Cells were stained with an anti-phospho-cofilin antibody, followed by an AlexaFluor488-conjugated secondary antibody (green). Scale bar = 10 µm. To exclude off-target effects, three different siRNAs against OCRL were independently applied. (B) Quantification of the mean fluorescence of cells stained for phospho-cofilin was performed by the Metamorph software. To enable direct comparison, all images were taken under the same magnification and laser intensity settings. The fluorescence intensity of OCRL-depleted cells is expressed as percentage of control cells. Results are from three independent experiments with 10 sections per experiment evaluated, and are shown as the mean ± SD. ***P < 0.001 (two-tailed Student's t-test). (C) HeLa cells were treated with siRNA against OCRL, followed by transfection with siRNA-resistant constructs expressing HA-tagged wild-type OCRL isoform a (HA-OCRL a) or the 5-phosphatase-inactive OCRL isoform a (HA-OCRLR493A/R500T a), prior to stimulation with 10 ng/ml EGF for 20 min, fixation and immunofluorescence analysis. OCRL variants were detected by staining cells with an anti-HA antibody, followed by an AlexaFluor546-conjugated secondary antibody (red). Phospho-cofilin was visualized using an anti-phospho-cofilin antibody, followed by an AlexaFluor488-conjugated secondary antibody (green). * indicates cells transfected with an siRNA-resistant OCRL construct. Scale bar = 10 µm. (D) Quantification of the mean fluorescence of phospho-cofilin-stained cells was performed by the Metamorph software. To enable direct comparison, all images were taken under the same magnification and laser intensity settings. The fluorescence intensity of OCRL-depleted cells expressing either HA-OCRL a or HA-OCRLR493A/R500T a is expressed as percentage of cells depleted of OCRL without OCRL re-expression. Results are from 10 different sections per condition, and are shown as the mean ± SD. ***P < 0.001 (two-tailed Student's t-test).
Figure 10.
Figure 10.
Expression of wild-type Rac1 in OCRL-depleted cells rescues enhanced phosphorylation levels of cofilin. (A) HeLa cells were treated with siRNA against OCRL, followed by transfection with constructs expressing myc-tagged Rac-wt or RacN17, prior to stimulation with 10 ng/ml EGF for 20 min, fixation and immunofluorescence analysis. Rac1 variants were detected by staining cells with an anti-myc antibody, followed by an AlexaFluor546-conjugated secondary antibody (red). Phospho-cofilin was visualized using an anti-phospho-cofilin antibody, followed by an AlexaFluor488-conjugated secondary antibody (green). * indicates cells transfected with a Rac1 expression vector. Scale bar = 10 µm. To exclude off-target effects, three different siRNAs against OCRL were independently applied. (B) Quantification of the mean fluorescence of phospho-cofilin-stained cells was performed by the Metamorph software. To enable direct comparison, all images were taken under the same magnification and laser intensity settings. The fluorescence intensity of OCRL-depleted cells expressing either Rac-wt or RacN17 is expressed as percentage of cells depleted of OCRL without Rac1 re-expression. Results are from three independent experiments with 10 sections per condition of each experiment evaluated and are shown as the mean ± SD. **P = 0.003 (two-tailed Student's t-test).
Figure 11.
Figure 11.
Wild-type Rac1 counteracts accumulation of MPR300 in enlarged endosomal vesicles. (A) HeLa cells were treated with OCRL-specific siRNA, followed by transfection with constructs expressing myc-tagged Rac-wt or RacN17, prior to fixation and immunofluorescence analysis. Rac1 variants were detected by staining cells with an anti-myc antibody, followed by an AlexaFluor546-conjugated secondary antibody (red). MPR300 localization was visualized by using an anti-MPR300 antibody, followed by an AlexaFluor488-conjugated secondary antibody (green). * indicates cells transfected with a Rac1 expression vector. The nucleus was visualized using DAPI (blue). Scale bar = 10 µm. (B) Quantification of MPR300-positive vesicles of various sizes was performed by the Metamorph software. To enable direct comparison, all images were taken under the same magnification and laser intensity settings. Sizes of MPR300-positive structures are given in arbitrary units (AU). The number of MPR300-positive vesicles per AU (≤50, 51–100, 101–150 and ≥151) is given as percentage of the number of vesicles counted in total. Results are from three independent experiments with 10 sections per condition of each experiment evaluated, and are shown as the mean ± SD (black square OCRL siRNA, white square OCRL siRNA+Rac-wt, gray square OCRL siRNA+RacN17). **P = 0.008; ***P < 0.001 (two-tailed Student's t-test).
Figure 12.
Figure 12.
Depletion of OCRL results in increased amounts of the cathepsin D intermediate form and the lysosomal protein Lamp1. (A) RNAi-treated HeLa cells were harvested and analyzed by immunoblotting using an anti-cathepsin D (catD) antibody (representative immunoblot—top panel). OCRL depletion was monitored by immunoblotting with an anti-OCRL antibody (middle panel), and an anti-tubulin antibody was used as loading control (lower panel). (B) Amounts of pro-cathepsin D (52 kDa), cathepsin D intermediate (48 kDa) and mature cathepsin D (34 kDa) were determined by scanning densitometry and normalization to tubulin. The amount of each cathepsin D form in OCRL-depleted cells is expressed as percentage of control cells (white square GFP siRNA, black square OCRL siRNA). Each bar is the mean ± SD of four independent experiments. *P = 0.024 (two-tailed Student's t-test). (C) HeLa cells were treated with OCRL- or GFP-specific siRNA, fixed and analyzed by confocal laser scanning microscopy. Cells were stained with an anti-Lamp1 antibody, followed by an AlexaFluor488-conjugated secondary antibody (green). The nucleus was visualized with DAPI (blue). Scale bar = 10 µm. (D) RNAi-treated HeLa cells were harvested and analyzed by immunoblotting using an anti-Lamp1 antibody (representative immunoblot—top panel). Depletion of OCRL was monitored by immunoblotting with an anti-OCRL antibody (middle panel), and an anti-tubulin antibody was used as loading control (lower panel). (E) The Lamp1 amount was determined by scanning densitometry and normalization to tubulin. The amount of Lamp1 in OCRL-depleted cells is expressed as percentage of control cells. Each bar is the mean ± SD of seven independent experiments. *P = 0.025 (two-tailed Student's t-test).

Similar articles

Cited by

References

    1. Lowe C.U., Terrey M., Mac L.E. Organic-aciduria, decreased renal ammonia production, hydrophthalmos, and mental retardation; a clinical entity. AMA Am. J. Dis. Child. 1952;83:164–184. - PubMed
    1. Loi M. Lowe syndrome. Orphanet J. Rare Dis. 2006;1:16. doi:10.1186/1750-1172-1-16. - DOI - PMC - PubMed
    1. Bockenhauer D., Bokenkamp A., van't Hoff W., Levtchenko E., Kist-van Holthe J.E., Tasic V., Ludwig M. Renal phenotype in Lowe Syndrome: a selective proximal tubular dysfunction. Clin. J. Am. Soc. Nephrol. 2008;3:1430–1436. doi:10.2215/CJN.00520108. - DOI - PMC - PubMed
    1. Attree O., Olivos I.M., Okabe I., Bailey L.C., Nelson D.L., Lewis R.A., McInnes R.R., Nussbaum R.L. The Lowe's oculocerebrorenal syndrome gene encodes a protein highly homologous to inositol polyphosphate-5-phosphatase. Nature. 1992;358:239–242. doi:10.1038/358239a0. - DOI - PubMed
    1. Nussbaum R.L., Orrison B.M., Janne P.A., Charnas L., Chinault A.C. Physical mapping and genomic structure of the Lowe syndrome gene OCRL1. Hum. Genet. 1997;99:145–150. doi:10.1007/s004390050329. - DOI - PubMed

Publication types

MeSH terms