. 2012 Oct;32(20):4226-36.
doi: 10.1128/MCB.00412-12. Epub 2012 Aug 20.

Cyclin-dependent kinase suppression by WEE1 kinase protects the genome through control of replication initiation and nucleotide consumption

Affiliations

Cyclin-dependent kinase suppression by WEE1 kinase protects the genome through control of replication initiation and nucleotide consumption

Halfdan Beck et al. Mol Cell Biol. 2012 Oct.

Abstract

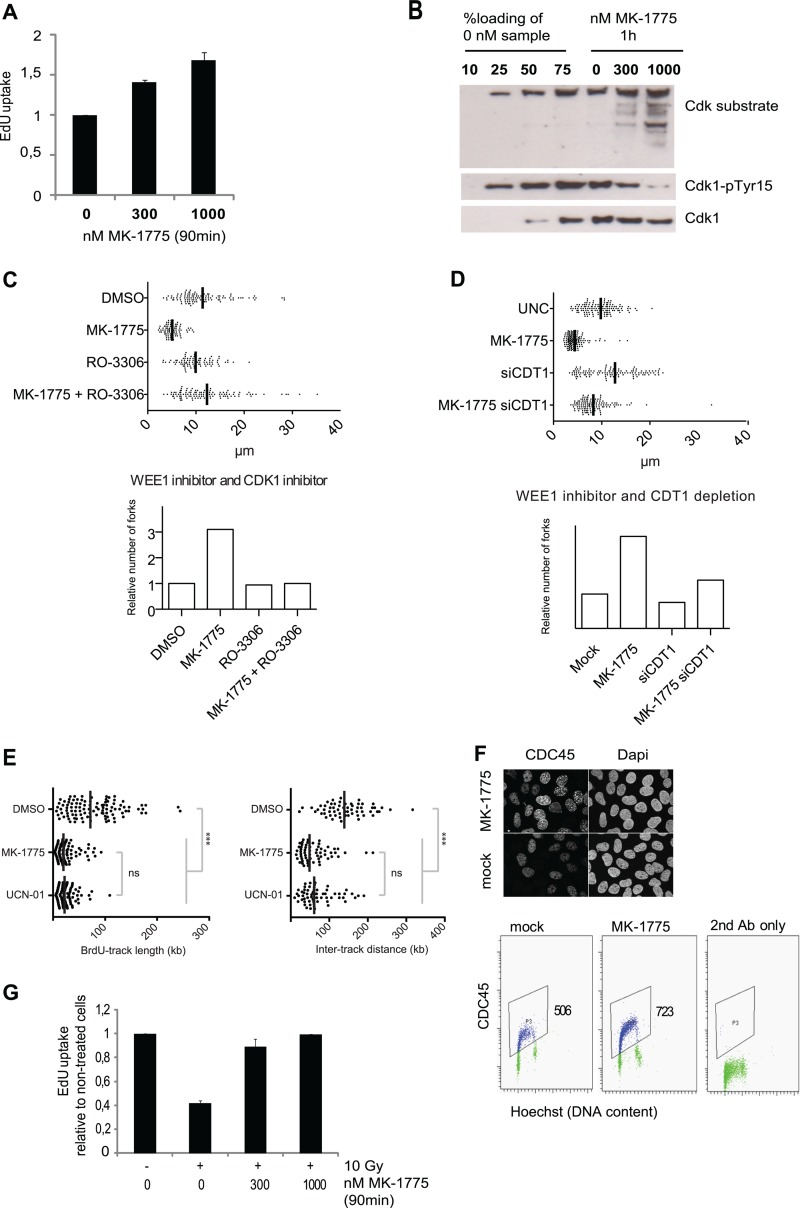
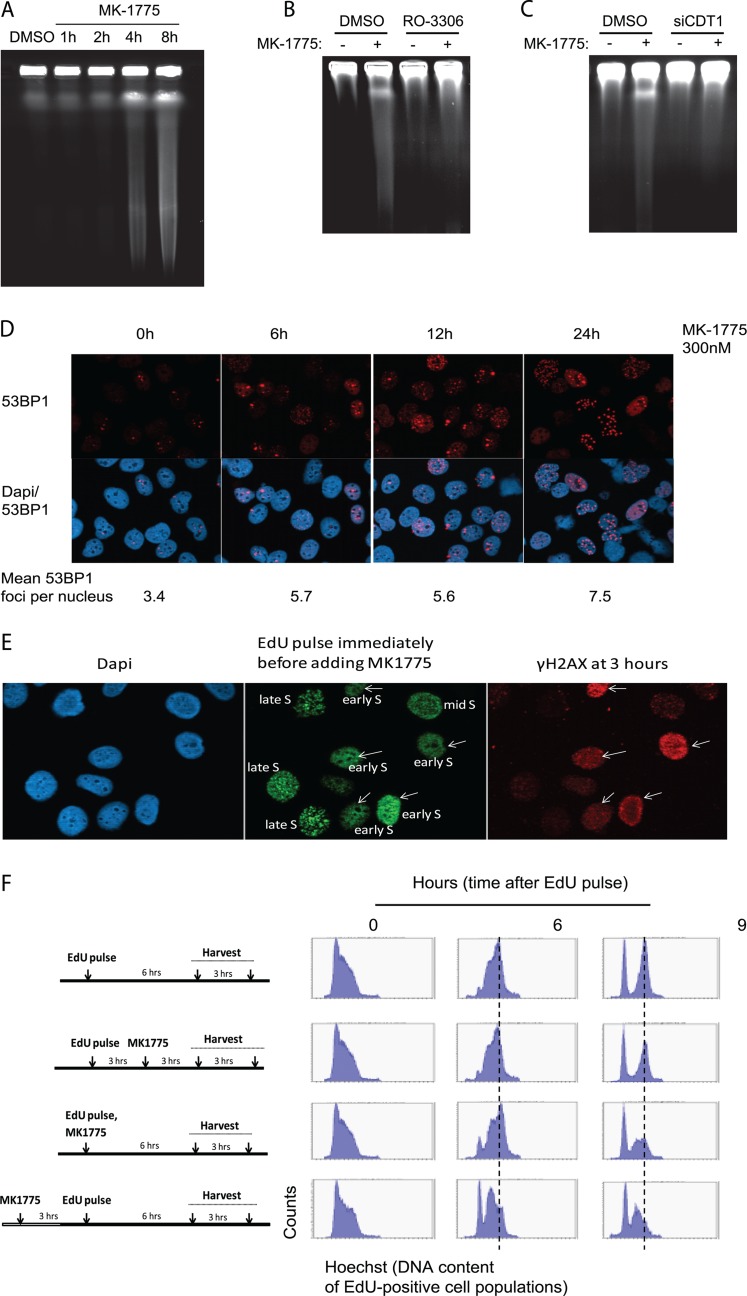
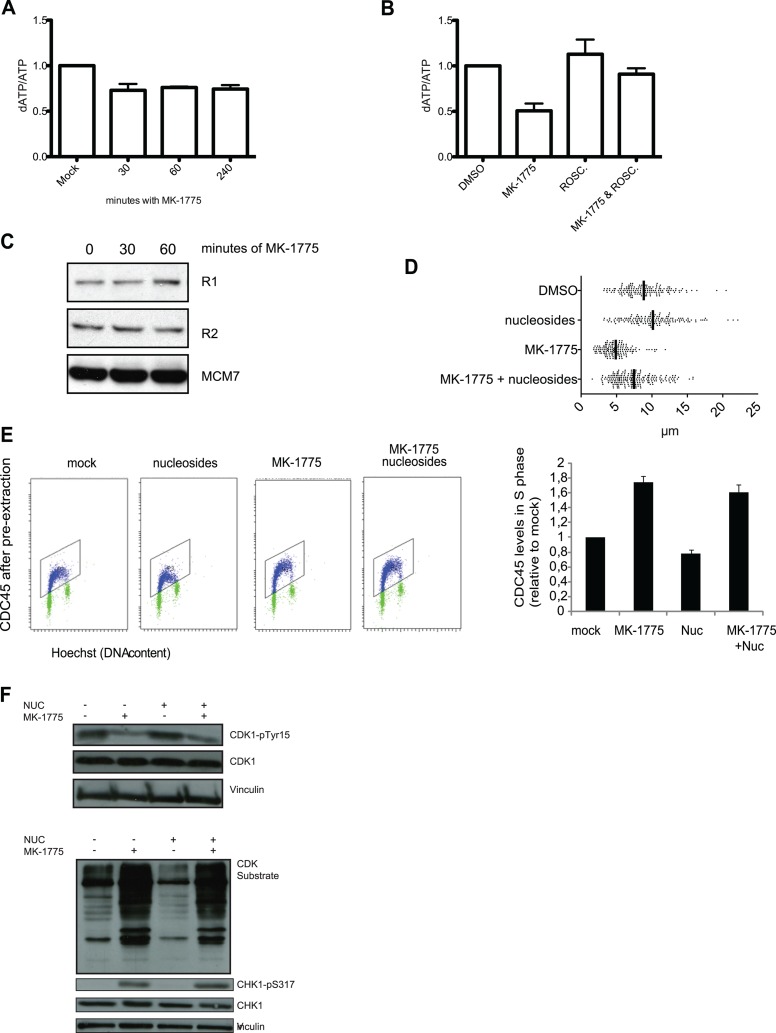
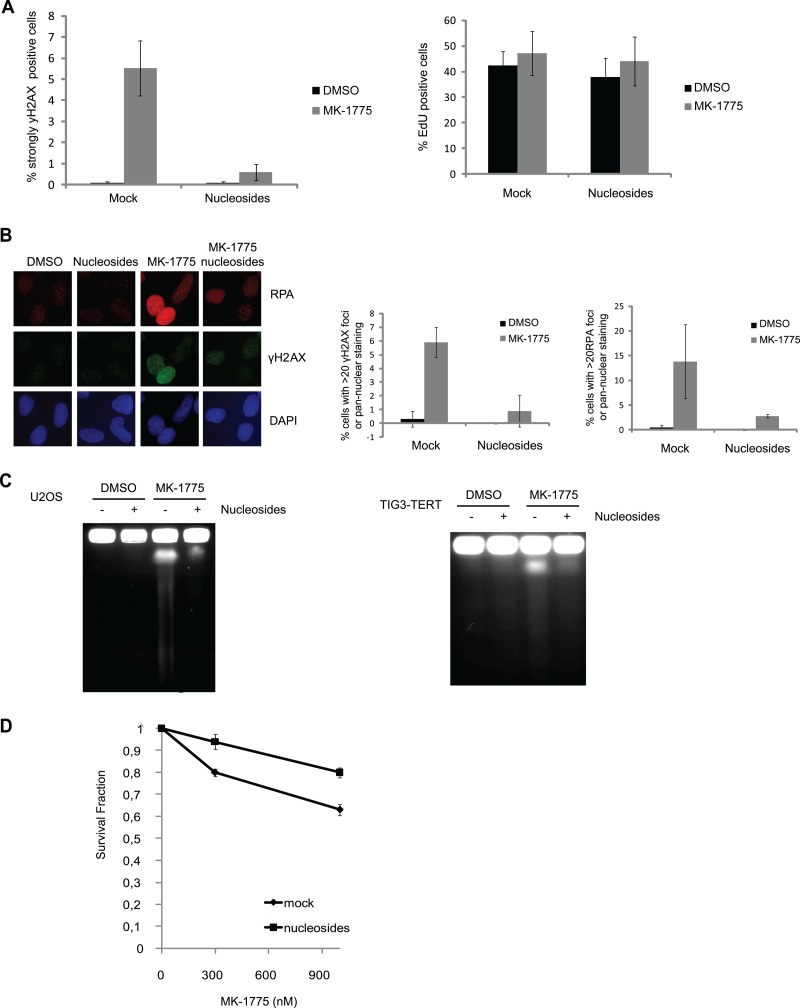
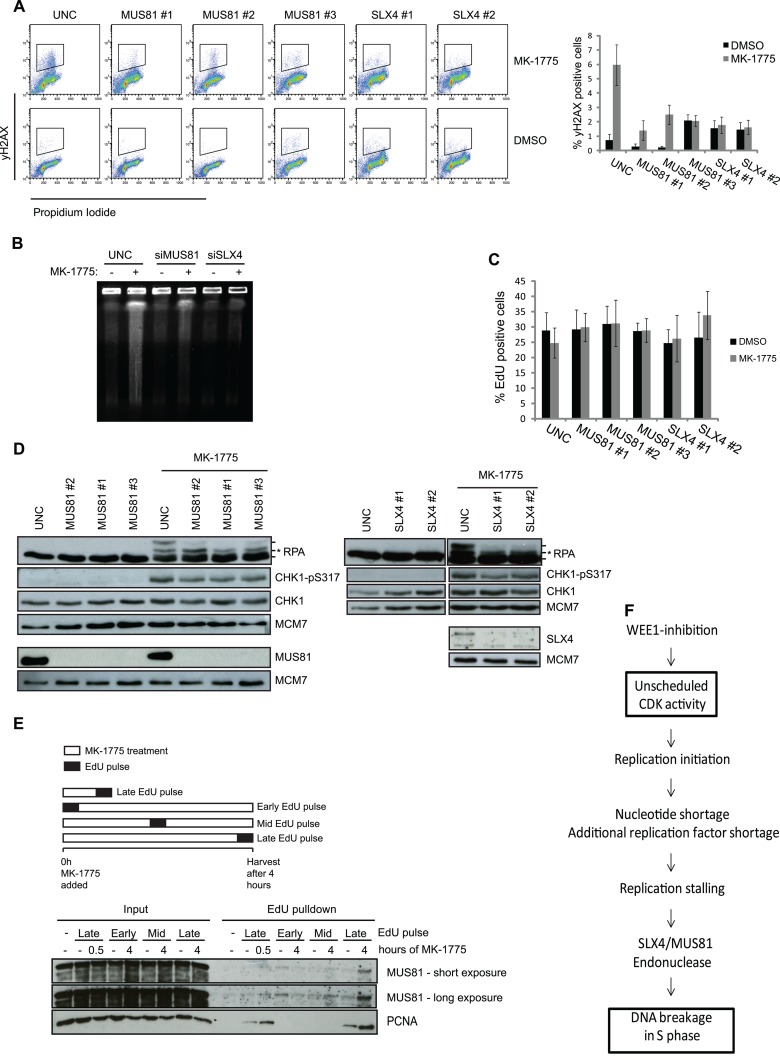
Activation of oncogenes or inhibition of WEE1 kinase deregulates cyclin-dependent kinase (CDK) activity and leads to replication stress; however, the underlying mechanism is not understood. We now show that elevation of CDK activity by inhibition of WEE1 kinase rapidly increases initiation of replication. This leads to nucleotide shortage and reduces replication fork speed, which is followed by SLX4/MUS81-mediated DNA double-strand breakage. Fork speed is normalized and DNA double-strand break (DSB) formation is suppressed when CDT1, a key factor for replication initiation, is depleted. Furthermore, addition of nucleosides counteracts the effects of unscheduled CDK activity on fork speed and DNA DSB formation. Finally, we show that WEE1 regulates the ionizing radiation (IR)-induced S-phase checkpoint, consistent with its role in control of replication initiation. In conclusion, these results suggest that deregulated CDK activity, such as that occurring following inhibition of WEE1 kinase or activation of oncogenes, induces replication stress and loss of genomic integrity through increased firing of replication origins and subsequent nucleotide shortage.


Figures

Fig 1
Fig 1
WEE1 suppresses CDK activity to control initiation of DNA replication. (A) Total cellular EdU uptake following treatment with the WEE1 inhibitor MK-1775. MK-1775 (300 or 1,000 nM) was added to U2OS cells, and after 30 min, cells were labeled with 1 μM EdU for 1 h. Cells were fixed and analyzed by the bar-coding flow cytometry method. Average EdU median values are shown relative to untreated cells. Error bars show standard errors of the means (SEM) (300 nM, n = 4; 1,000 nM, n = 3). (B) U2OS cells were treated with MK-1775 (0, 300, or 1,000 nM), and cell lysates were collected after 1 h and processed for Western blotting. The left four lanes were loaded with different amounts of the untreated sample (0 nM). (C) (Top) Replication track length analyzed by DNA fiber spreading. The WEE1 inhibitor MK-1775 (1 μM) and the CDK1 inhibitor RO-3306 (10 μM) were added for 30 min before pulses with CldU and subsequently with IdU of 20 min each. The total length of CldU and IdU was measured. (Bottom) Relative fork number calculated by dividing cellular EdU incorporation from panel B by the corresponding replication fork track length. (D) (Top) Replication track length analyzed by DNA fiber spreading. Cells were transfected with siRNA, and 48 h later the WEE1 inhibitor MK-1775 was added to a final concentration of 1 μM for 30 min followed by pulses with CldU and IdU. Total length of CldU and IdU was measured. (Bottom) Relative fork number calculated by dividing cellular EdU incorporation from panel B by the corresponding replication fork track length. (E) Single-molecule analysis of DNA replication by molecular combing. DMSO (0.1%), MK-1775 (1 μM), and UCN-01 (300 nM) were added 45 min before cells were pulse-labeled with BrdU (25 μM, 45 min). (Left) Distribution of BrdU track lengths. ***, P < 10−4; ns, nonsignificant (P = 0.156) (Mann-Whitney; n > 100). (Right) Distribution of intertrack distances. ***, P < 10−4; ns, P = 0.157 (Mann-Whitney; n = 60). (F) Measurement of CDC45 chromatin loading after preextraction of cells with detergent. U2OS cells were treated with 1 μM MK-1775, preextracted for 5 min in detergent buffer, fixed, and stained for CDC45L for immunofluorescence (above) and flow cytometry (below), respectively. Values are medians for the gated cell populations. (G) Abrogation of the IR-induced S-phase checkpoint by MK-1775. U2OS cells were treated with MK-1775 (0, 300, and 1,000 nM) at 15 min before IR (10 Gy). After 15 min, cells were labeled with 1 μM EdU for 1 h, fixed, and analyzed with the bar-coding method for flow cytometry. Median values relative to untreated cells are shown. Error bars show SEM (for 300 nM, n = 4; for 1,000 nM, n = 2).
Fig 2
Fig 2
DNA damage occurs rapidly after WEE1 inhibition as a consequence of the increased initiation. (A) Pulsed-field gel electrophoresis. U2OS cells were treated with the WEE1 inhibitor MK-1775 (2 μM) for the indicated duration. (B) Pulsed-field gel electrophoresis as done for panel A with the WEE1 inhibitor MK-1775 (2 μM) and the CDK1 inhibitor RO-3306 (10 μM) for 4 h. (C) As described for panel A with siRNA against CDT1 for 48 h and MK-1775 (2 μM) for 4 h. (D) Immunofluorescence images of 53BP1 foci after 300 nM MK-1775 treatment. U2OS cells were preextracted with detergent before fixation at the indicated times and stained for 53BP1 and for DNA with DAPI. Numbers are average 53BP1 foci per nuclei (at least 580 cells were counted per treatment). (E) Strong γH2AX staining occurs preferentially in cells that were in early S phase at the time of MK-1775 addition. U2OS cells were pulsed with EdU (10 μM, 10 min) immediately before MK-1775 addition (1 μM), and cells were harvested and stained for γH2AX and EdU at 3 h later. The pattern of EdU foci was used to distinguish between early-, mid-, and late-S-phase cells. (F) S-phase progression is delayed in cells that were in late G1/early S phase at the time of MK-1775 addition (bottom two panels), while cells in late S phase are less affected (second panel from top). EdU pulse-labeling (10 μM, 10 min) and MK-1775 treatment (1 μM) were done at the indicated times. MK-1775 was present in the cell culture medium until cell harvest. During analysis, the EdU-positive cells were gated in each sample, and DNA profiles (cell cycle profiles) are shown for the gated EdU-positive cell populations.
Fig 3
Fig 3
WEE1 inhibition leads to enhanced nucleotide consumption, and nucleoside addition normalizes replication fork speed. (A) U2OS cells were exposed to MK-1775 (1 μM) for the indicated times or mock exposed to DMSO only. Small-molecule extracts were tested for dATP and ATP content, and the results are presented as dATP/ATP ratios. Data are means ± SEM for three biological replicates. (B) U2OS cells were exposed to MK-1775 (1 μM), roscovitine (25 μM), or MK-1775 plus roscovitine for 30 min or DMSO only, and dATP was quantified as for panel A. Data are mean dATP/ATP ratios ± SEM for three (DMSO, MK-1775, and roscovitine) or four (MK-1775 plus roscovitine) biological replicates. *, P < 0.05. (C) U2OS cells were treated with MK-1775 (1 μM) for the indicated periods. The cells were harvested and processed for immunoblotting. Cells were stained with antibodies against the R1 and R2 subunits of ribonucleotide reductase and MCM7 as a loading control. (D) Replication track length analyzed by DNA fiber spreading. Cells were transfected with siRNA and 48 h later pulsed with CldU and subsequently with IdU for 20 min each. Total length of CldU and IdU was measured. The WEE1 inhibitor MK-1775 was added to a final concentration of 1 μM for 30 min before the pulses with CldU and IdU. Nucleosides (5 μM) were added to growth medium simultaneously with MK-1775. (E) U2OS cell were treated with MK-1775 (0 or 1000 nM) in the presence or absence of extra nucleosides (Embryomax ES nucleosides at 1:50) for 1 h. Cells were treated and processed as for Fig. 1F and analyzed by the flow cytometry bar-coding method. The graph shows quantification of CDC45 levels in S phase. Background levels in S phase after staining with the second antibody alone were subtracted. Data are means and SEM from three independent experiments. (F) U2OS cells were treated with MK-1775 (2 μM), with or without nucleosides (5 μM) for 30 min. The cells were harvested and processed for immunoblotting. Cells were stained with antibodies against CDK1-pY15, CDK1, CHK1-p317, CHK1, and CDK substrates and vinculin as a loading control.
Fig 4
Fig 4
Nucleoside addition suppresses DNA damage induced by deregulation of the WEE1-CDK pathway. (A) U2OS cells were treated with MK-1775 (2 μM), with or without nucleosides (5 μM) for 4 h. EdU (10 μM) was added during the last 30 min. The cells were harvested and processed for FACS. Cells were stained with propidium iodide (PI) and antibody against γH2AX, and EdU was detected through the Click-iT reaction. Data are means ± SEM from five experiments (left) and three experiments (right). (B) Cells were seeded on coverslips and analyzed as described for panel A. The cells were fixed and stained with DAPI and for antibodies against RPA and γH2AX. Data are means ± SEM from three experiments. (C) Pulsed-field gel electrophoresis. U2OS (left) and Tig3-tert (right) cells were treated with the WEE1 inhibitor MK-1775 (2 μM) and nucleosides (5 μM) for 4 h. (D) Clonogenic survival after 6 h treatment with MK-1775 (0, 300, and 1,000 nM) in the presence (nucleosides) and absence (mock) of Embryomax ES nucleosides at 1:25. Survival is shown as a fraction of the cells treated with 0 nM MK-1775. Data are means ± SEM from three independent experiments. The cloning efficiency of cells treated with nucleosides alone relative to untreated cells was 0.94 ± 0.04.
Fig 5
Fig 5
DNA DSBs formation but not ATR signaling is mediated by SLX4-MUS81 after WEE1 inhibition. (A) U2OS cells were transfected with siRNAs targeting MUS81 and SLX4. Transfection with UNC was included as a negative control. The cells were treated with EdU (10 μM) for 30 min prior to harvest, and at 48 h posttransfection the cells were harvested and processed for FACS. Cells were stained with PI and antibody against γH2AX, and EdU was detected through the Click-iT reaction. FACS analysis was carried out with cells stained for γH2AX and PI, and data are means ± SEM from a minimum of five experiments. (B) U2OS cells were reverse transfected with siRNA targeting MUS81 and SLX4 for 48 h, treated with the WEE1 inhibitor MK-1775 (2 μM) for 4 h, and processed for PFGE. (C) EdU graphs from the experiment whose results are shown in panel A. (D) Cells were treated as for panel A and then harvested and processed for immunoblotting. Cell lysates were stained with antibodies against RPA, CHK1-p317, CHK1, MUS81, SLX4, and MCM7 as a loading control. In the RPA panels, the asterisk shows the ATR-dependent RPA phosphorylation, whereas the upper RPA band is the DNA-PK mediated phosphorylation of S4 and S8. (E) Cells were pulsed with 12 min of EdU at the start, middle, or end of MK-1775 treatment. The cells were harvested at the indicated time points and processed for iPOND to pull down nascent proteins. Lysates were processed for immunoblotting using antibodies against MUS81 and PCNA. A minus sign denotes a non-Click-iT control, where DMSO was used instead of biotin-azide to detect incorporated EdU. (F) Diagram depicting how increased CDK activity following WEE1 inhibition can lead to DNA breakage in S-phase cells via increased origin firing and ensuing enhanced nucleotide consumption.

Similar articles

Cited by

References

    1. Anglana M, Apiou F, Bensimon A, Debatisse M. 2003. Dynamics of DNA replication in mammalian somatic cells: nucleotide pool modulates origin choice and interorigin spacing. Cell 114:385–394 - PubMed
    1. Bartkova J, et al. 2005. DNA damage response as a candidate anti-cancer barrier in early human tumorigenesis. Nature 434:864–870 - PubMed
    1. Bartkova J, et al. 2006. Oncogene-induced senescence is part of the tumorigenesis barrier imposed by DNA damage checkpoints. Nature 444:633–637 - PubMed
    1. Beck H, et al. 2010. Regulators of cyclin-dependent kinases are crucial for maintaining genome integrity in S phase. J. Cell Biol. 188:629–638 - PMC - PubMed
    1. Bester AC, et al. 2011. Nucleotide deficiency promotes genomic instability in early stages of cancer development. Cell 145:435–446 - PMC - PubMed

Publication types

MeSH terms

LinkOut - more resources