. 2012 Nov;32(21):4323-36.
doi: 10.1128/MCB.06785-11. Epub 2012 Aug 20.

Poly(A) binding protein C1 is essential for efficient L1 retrotransposition and affects L1 RNP formation

Affiliations

Poly(A) binding protein C1 is essential for efficient L1 retrotransposition and affects L1 RNP formation

Lixin Dai et al. Mol Cell Biol. 2012 Nov.

Abstract

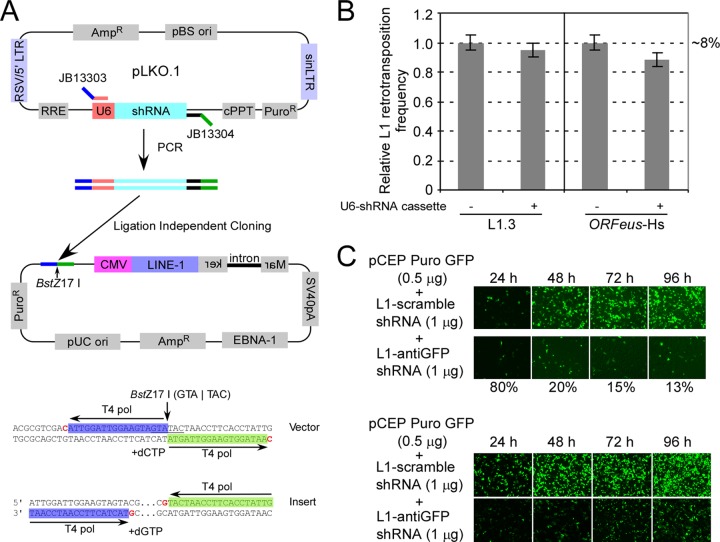
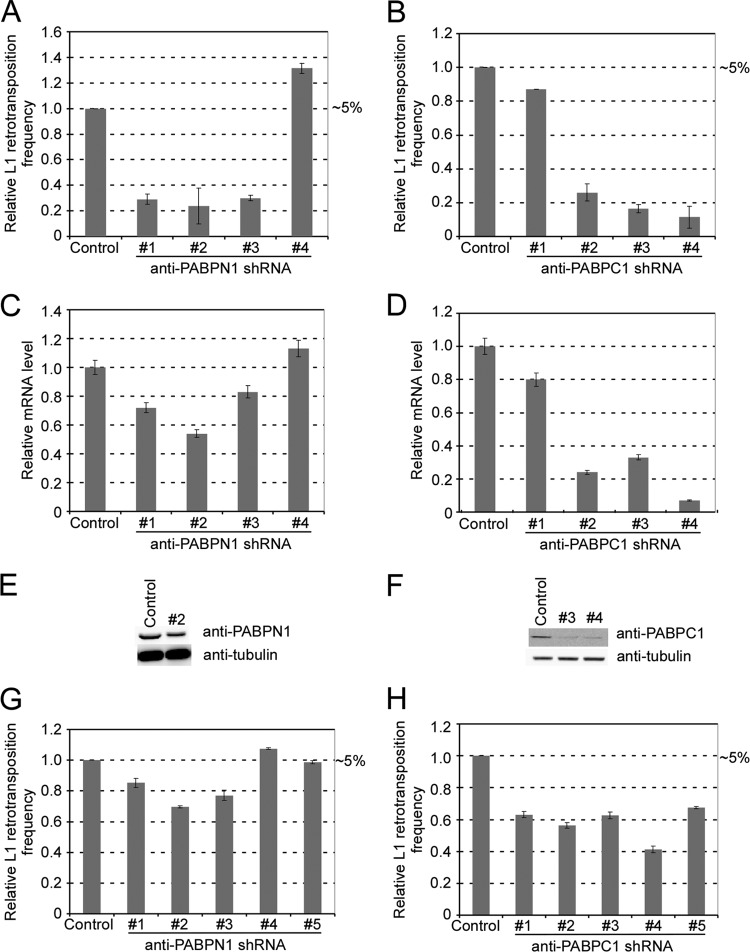
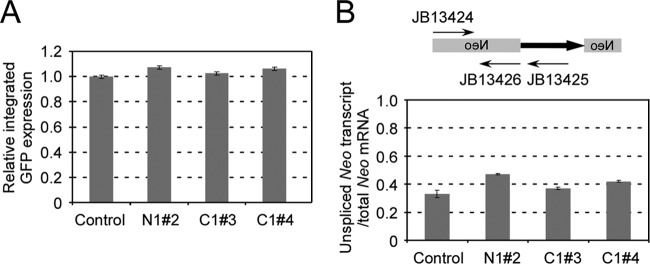
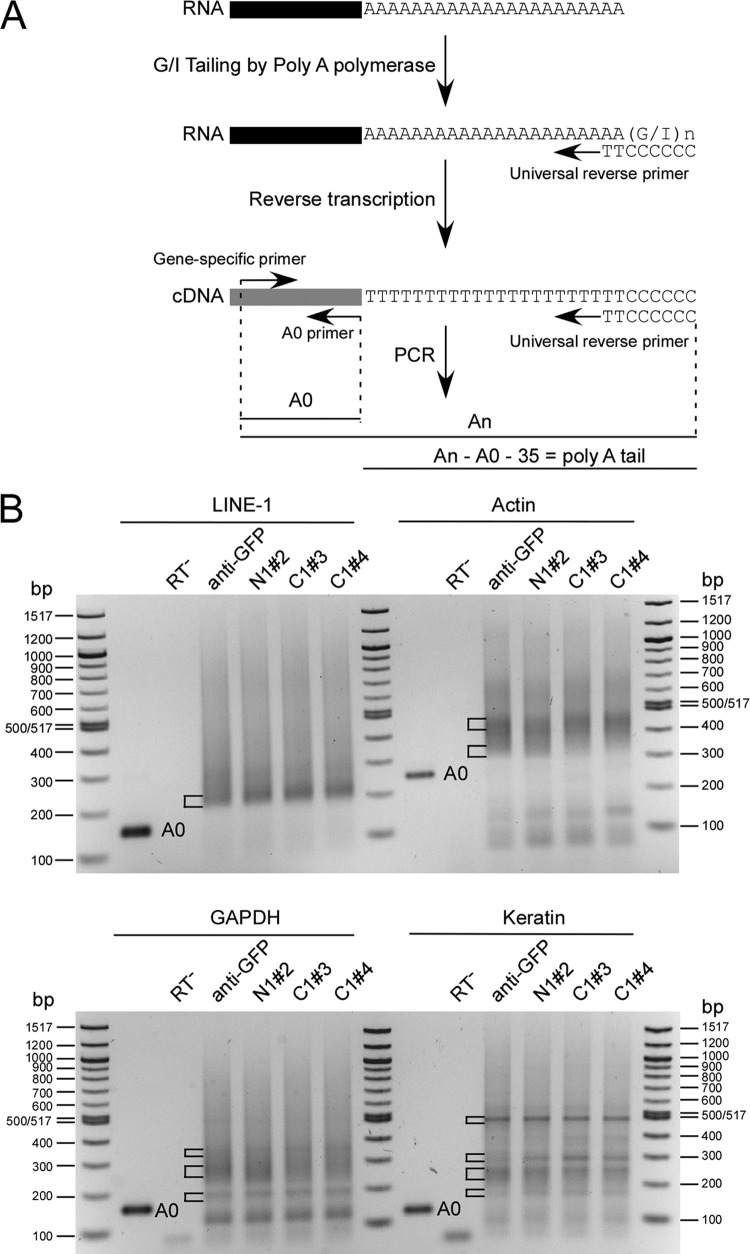
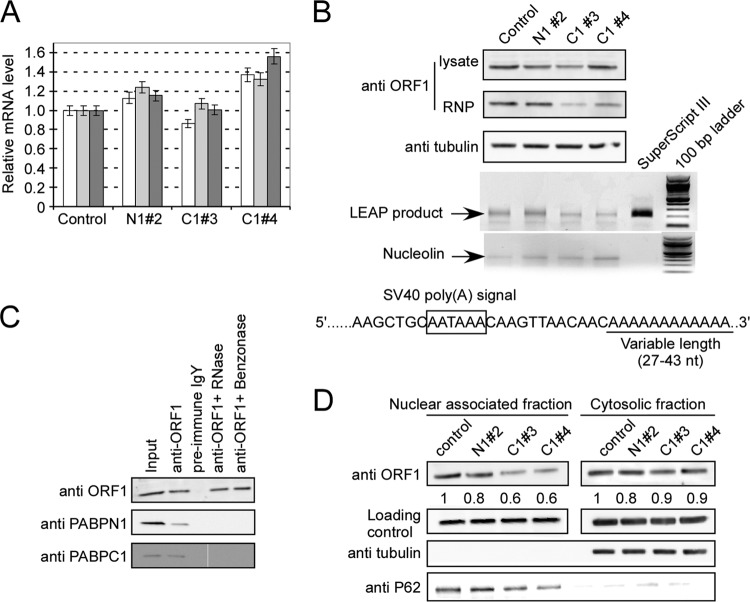
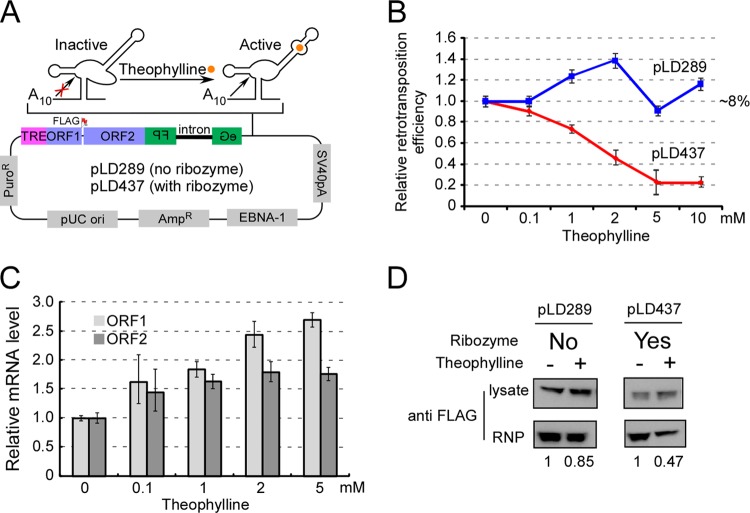
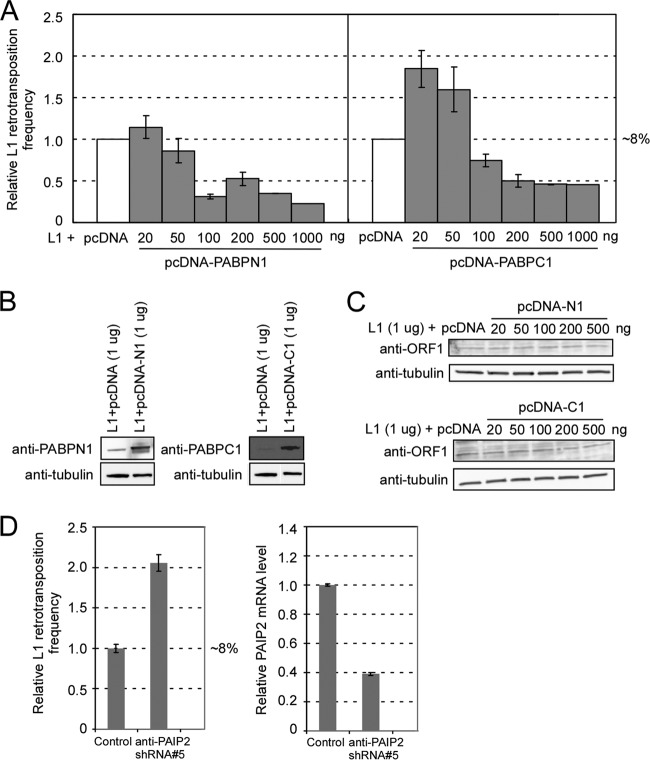
Poly(A) binding proteins (PABPs) specifically bind the polyadenosine tail of mRNA and have been shown to be important for RNA polyadenylation, translation initiation, and mRNA stability. Using a modified L1 retrotransposition vector, we examined the effects of two PABPs (encoded by PABPN1 and PABPC1) on the retrotransposition activity of the L1 non-long-terminal-repeat (non-LTR) retrotransposon in both HeLa and HEK293T cells. We demonstrated that knockdown of these two genes by RNA interference (RNAi) effectively reduced L1 retrotransposition by 70 to 80% without significantly changing L1 transcription or translation or the status of the poly(A) tail. We identified that both poly(A) binding proteins were associated with the L1 ribonucleoprotein complex, presumably through L1 mRNA. Depletion of PABPC1 caused a defect in L1 RNP formation. Knockdown of the PABPC1 inhibitor PAIP2 increased L1 retrotransposition up to 2-fold. Low levels of exogenous overexpression of PABPN1 and PABPC1 increased L1 retrotransposition, whereas unregulated overexpression of these two proteins caused pleiotropic effects, such as hypersensitivity to puromycin and decreased L1 activity. Our data suggest that PABPC1 is essential for the formation of L1 RNA-protein complexes and may play a role in L1 RNP translocation in the host cell.


Figures

Fig 1
Fig 1
(A) (Top) Strategy of subcloning U6-shRNA cassette from TRC shRNA plasmid into L1 retrotransposition vector. Blue and green lines represent the adaptor sequences for LIC cloning. (Bottom) Sequence of LIC adaptor sequence used in this study. The adaptor includes sequences highlighted with blue and green and a BstZ17I site (underlined). Residues in red represent the boundaries of overhangs after T4 polymerase treatment. (B) Relative L1 retrotransposition efficiencies, with and without U6-shRNA cassette, for native human L1.3 and synthetic human L1 (ORFeus-Hs). The absolute value of L1 activity from the vector without the U6-shRNA cassette was 8% and was arbitrarily set at 1 for comparison. Six independent experiments were done, and standard errors are shown. (C) (Top) Subcloned anti-eGFP shRNA efficiently knocked down eGFP expression in HeLa cells. (Bottom) Subcloned anti-eGFP shRNA efficiently knocked down eGFP expression in HEK293T cells. Cells were cotransfected with pCEP-puro GFP (0.5 μg) and pLD108-shRNA (1.0 μg) plasmids, and eGFP expression was monitored at different time points until 96 h posttransfection. The numbers at the bottom represent relative fluorescence signals of the bottom row (with anti-eGFP shRNA) compared to the top row (with scrambled shRNA).
Fig 2
Fig 2
PABPN1 and PABPC1 affect L1 retrotransposition in HeLa cells. (A) Relative L1 retrotransposition with the PABPN1 gene knocked down. Control, pLD108-anti-eGFP shRNA. shRNAs 1 to 4, pLD108-antiPABPN1 shRNAs. The absolute value of the L1 retrotransposition level of the control was 5% and was arbitrarily set at 1 for comparison. (B) Relative L1 retrotransposition with the PABPC1 gene knocked down. Control, pLD108-anti-eGFP shRNA. shRNAs 1 to 4 are vector pLD108-antiPABPC1 shRNAs. The absolute value of the L1 retrotransposition level of the control was 5% and was arbitrarily set at 1 for comparison. (C) Relative PABPN1 mRNA levels in cells transfected with the constructs used for panel A. After 3 days of puromycin selection, RNAs were extracted and PABPN1 mRNA levels were measured by real-time RT-PCR and normalized by the simultaneous measurement of the beta-actin gene. (D) Relative PABPC1 mRNA levels in cells transfected with the constructs used for panel B. After 3 days of puromycin selection, RNAs were extracted and PABPC1 mRNA levels were measured by real-time RT-PCR. The mRNA levels were normalized by the simultaneous measurement of the beta-actin transcript. (E) PABPN1 protein level in cells transfected with pLD108-antiPABPN1#2. Cell lysates were obtained after 3 days of puromycin selection and probed with anti-PABPN1 antibody. (F) PABPC1 protein levels in cells transfected with pLD108-antiPABPC1#3 and pLD108-antiPABPC1#4. Cell lysates were obtained after 3 days of puromycin selection and probed with anti-PABPN1 antibody. (G) L1 retrotransposition efficiencies in HeLa cell pools preinfected with lentiviruses containing anti-PABPN1 shRNAs 1 to 5. The absolute value of the L1 retrotransposition level in the control was 5% and was arbitrarily set at 1 for comparison. (H) L1 retrotransposition efficiencies in HeLa cell pools preinfected with lentiviruses containing anti-PABPC1 shRNAs 1 to 5. The absolute value of the L1 retrotransposition level in the control was 5% and was arbitrarily set at 1 for comparison. All data represent the averaged results for at least three independent experiments. Error bars represent standard deviations.
Fig 3
Fig 3
(A) Effect of shRNA cassette on expression of integrated eGFP marker. A pool of HEK293T cells that had an integrated eGFP marker was first acquired by L1 retrotransposition using L1RP-eGFP. The cells were then transfected with pLD108 containing different shRNA cassettes and analyzed by FACS analysis 1 week after transfection. eGFP expression of the control (pLD108-scramble) was set at 100%. A total of six independent experiments were done, and standard errors are shown. (B) Effect of shRNA on the splicing ability of the globin intron within the neo marker. Total RNAs were extracted from HeLa cells transfected with different vectors after 3 days of puromycin selection. Real-time RT-PCR was performed using two exon primers (JB13424 and JB13426) or exon-intron primers (JB13424 and JB13425) for the neoAI reporter. The ratio of unspliced RNA and total RNA was calculated. Three experiments were performed, and standard errors are shown.
Fig 4
Fig 4
Effects of knocking down PABPs on the poly(A) tail length of L1 and other genes. (A) Scheme of poly(A) tail length assay, redrawn from the user protocol of a poly(A) tail length assay kit (Affymetrix). The A0 primer represents the reverse primer located just before the poly(A) tail for each gene of interest. (B) Poly(A) tail lengths measured for L1, actin, GAPDH, and keratin mRNAs. Total RNAs were extracted from HeLa cells (after 5 days of puromycin selection) transfected with pLD108-anti-eGFP, pLD108-antiPABPN1#2, pLD108-antiPABPC1#3, and pLD108-antiPABPC1#4, and poly(A) tail lengths were measured by use of a poly(A) tail length assay kit. A0 products are unique-sequence PCR products which correspond to the appropriate mRNA and lack any 3′ poly(A) tail. The exact sizes of A0 products are as follows: for L1, 142 bp; for actin, 223 bp; for GAPDH, 153 bp; and for keratin, 122 bp. “An” represents PCR products containing mRNAs with different poly(A) tail lengths. The inferred length of the poly(A) tail was determined as the length difference between An and the sum of the lengths of A0 and the universal reverse primer (35 nt).
Fig 5
Fig 5
Effects of knocking down PABPs on expression of L1. (A) Relative mRNA levels of Puro transcript; L1 ORF1 and ORF2 levels were measured by real-time RT-PCR. White bars, Puro; light gray bars, ORF1; dark gray bars, ORF2. The mRNA level of pLD108-anti-eGFP was used as a control and set at 1. (B) Expression of L1 ORF1p. Whole-cell lysates prepared from HEK293T cells (after 5 days of puromycin selection) transfected with different L1-shRNA coexpression vectors were probed with anti-ORF1 antibody. The RNP samples were prepared from the same amount (500 μl) of whole-cell lysate, and the pellets were resuspended in 50 μl PBS. Ten-microliter RNP samples were loaded and probed with the anti-ORF1 antibody. The same amount of RNP sample (2 μg) was used in the LEAP assay, and 10 μl of PCR product from each reaction was loaded onto a 1.5% agarose gel. The nucleolin mRNA panel represents the SuperScript RT-PCR product of this cellular mRNA marker for all RNP preparations. The LEAP signal is shown as a semiquantitative readout of the ability of the L1 RNP to produce its own cDNA. Sequences of LEAP products indicated that the cloned products contained poly(A) tails of 27 to 43 nt. (C) Both PABPN1 and PABPC1 bind to ORF1p through L1 RNA. Cell lysate prepared from HEK293T cells transfected with pLD108 was immunoprecipitated with anti-ORF1 IgY and probed with rabbit anti-ORF1p, anti-PABPN1, and anti-PABPC1 antibodies. Lane 1, input; lane 2, anti-ORF1 IgY was used for co-IP; lane 3, preimmune IgY antibody was used for co-IP; lane 4, cell lysate was pretreated with RNase before co-IP with anti-ORF1 IgY; lane 5, cell lysate was pretreated with Benzonase before co-IP with anti-ORF1 IgY. (D) Localization of ORF1 protein. Nucleus-associated and cytosolic fractions were prepared from HEK293T cells (after 5 days of puromycin selection) transfected with different L1-shRNA coexpression plasmids and probed for anti-ORF1 antibody. Alpha-tubulin and p62 (nucleoporin 62) were used as quality control markers for cell fractionations, and p53 was used as a loading control. The numbers under the top panels represent the relative ORF1p abundance in each lane compared to the control. All experiments were performed at least twice, and representative gels are shown.
Fig 6
Fig 6
Reduced poly(A) tail length affects L1 RNP formation. (A) Diagram of an L1 retrotransposition construct with a hammerhead ribozyme-aptamer controlled by theophylline. A self-cleavage ribozyme-aptamer (74) was inserted between the eGFPAI marker and the simian virus 40 (SV40) poly(A) signal that normally specifies polyadenylation in this construct. Upon adding theophylline to the medium, the ribozyme cleaves off the SV40 poly(A) signal and therefore leaves only a short oligo(A) tail (A10). Orange circle, theophylline; TRE, tetracycline-regulated promoter; FLAG, FLAG epitope tag at C terminus of ORF1p; pLD289, L1 construct without the ribozyme cassette inserted; pLD437, L1 construct with the ribozyme cassette inserted. (B) Retrotransposition ability of pLD289 and pLD437 in HEK293T-tet-on cells with different concentrations of theophylline. The absolute activity of pLD289 (∼8%) was set at 1. (C) Relative mRNA levels of L1 ORF1 and ORF2 in Tet-on HEK293T cells (transfected with pLD437) with various concentrations of theophylline. Tet-on HEK293T cells were transfected with pLD437. The next day, doxycycline (final concentration, 500 ng/ml) and theophylline were added to the medium. At 5 days posttransfection, total RNA was prepared and real-time RT-PCR was performed. Both the beta-actin and puromycin genes were used as internal controls. All data represent averaged results for at least three independent experiments. Error bars represent standard deviations. (D) A shorter poly(A) tail affects L1 RNP formation. Tet-on HEK293T cells were transfected with pLD289 and pLD437. Transfected cells were selected in DMEM containing 1 μg/ml puromycin and 500 ng/ml doxycycline for 5 days. Theophylline was added to a final concentration of 10 mM and incubated for 2 more days. L1 RNPs were prepared from each cell pool and probed with anti-FLAG antibody. The signals were quantified using Multi-Gauge software (Fujifilm), based on band densitometry. For each sample pair, the signal with theophylline was compared to the signal without theophylline (assigned as 1), with normalization to signals from the total cell lysate (upper panel). The experiment was done twice from two independent transfections and cell cultures.
Fig 7
Fig 7
Effects of overexpression of PABPN1 and PABPC1 on L1 retrotransposition. (A) pLD190 (L1-eGFPAI) (1 μg) was cotransfected with different amounts of pcDNA-PABPN1 (pLD141) or pcDNA-PABPC1 (pLD142), and the retrotransposition efficiency was compared with the result of cotransfection of pLD190 and the same amount of pcDNA3.1 empty vector in HEK293T cells, which was set at 100%. (B) Overexpression of PABPs in HEK293T cells transfected with pcDNA-PABPN1 and pcDNA-PABPC1. Cell lysates were prepared at 3 days posttransfection and probed with anti-PABPN1 and anti-PABPC1 antibodies. Alpha-tubulin was used as an internal control. (C) ORF1p expression was unchanged with PABP overexpression. Cell lysates were prepared at 3 days posttransfection and probed with anti-ORF1 IgY. Alpha-tubulin was used as an internal control. (D) Effect of knocking down PAIP2 on L1 retrotransposition. Control, pLD190-scramble shRNA; anti-PAIP2 shRNA#5, pLD190-antiPAIP2 shRNA#5 (TRCN0000153678). (Left) Relative L1 retrotransposition frequency; (right) relative mRNA level of PAIP2 in the cells. mRNA levels were normalized by the simultaneous measurement of the beta-actin gene.

Similar articles

Cited by

References

    1. Afonina E, Stauber R, Pavlakis GN. 1998. The human poly(A)-binding protein 1 shuttles between the nucleus and the cytoplasm. J. Biol. Chem. 273: 13015–13021 - PubMed
    1. An W, et al. 2011. Characterization of a synthetic human LINE-1 retrotransposon ORFeus-Hs. Mob. DNA 2: 2 doi:10.1186/1759-8753-2-2 - DOI - PMC - PubMed
    1. Aslanidis C, de Jong PJ. 1990. Ligation-independent cloning of PCR products (LIC-PCR). Nucleic Acids Res. 18: 6069–6074 - PMC - PubMed
    1. Athanikar JN, Badge RM, Moran JV. 2004. A YY1-binding site is required for accurate human LINE-1 transcription initiation. Nucleic Acids Res. 32: 3846–3855 doi:10.1093/nar/gkh698 - DOI - PMC - PubMed
    1. Belancio VP, Whelton M, Deininger P. 2007. Requirements for polyadenylation at the 3′ end of LINE-1 elements. Gene 390: 98–107 doi:10.1016/j.gene.2006.07.029 - DOI - PubMed

Publication types

MeSH terms

LinkOut - more resources