Review
. 2012 Oct;29(10):1153-75.
doi: 10.1039/c2np20059g. Epub 2012 Aug 21.

Terpenoid synthase structures: a so far incomplete view of complex catalysis

Affiliations
Review

Terpenoid synthase structures: a so far incomplete view of complex catalysis

Yang Gao et al. Nat Prod Rep. 2012 Oct.

Abstract

The complexity of terpenoid natural products has drawn significant interest, particularly since their common (poly)isoprenyl origins were discovered. Notably, much of this complexity is derived from the highly variable cyclized and/or rearranged nature of the observed hydrocarbon skeletal structures. Indeed, at least in some cases it is difficult to immediately recognize their derivation from poly-isoprenyl precursors. Nevertheless, these diverse structures are formed by sequential elongation to acyclic precursors, most often with subsequent cyclization and/or rearrangement. Strikingly, the reactions used to assemble and diversify terpenoid backbones share a common carbocationic driven mechanism, although the means by which the initial carbocation is generated does vary. High-resolution crystal structures have been obtained for at least representative examples from each of the various types of enzymes involved in producing terpenoid hydrocarbon backbones. However, while this has certainly led to some insights into the enzymatic structure-function relationships underlying the elongation and simpler cyclization reactions, our understanding of the more complex cyclization and/or rearrangement reactions remains limited. Accordingly, selected examples are discussed here to demonstrate our current understanding, its limits, and potential ways forward.


Figures

Fig. 1
Fig. 1
A scheme depicting general terpenoid nomenclature and corresponding precursors (OPP, diphosphate; PPi, inorganic pyrophosphate).
Fig. 2
Fig. 2
The proposed evolutionary relationships among the terpenoid synthases.
Fig. 3
Fig. 3
A depiction of avian farnesyl diphosphate synthase (ribbon diagram, with location of aspartate-rich motifs indicated by red coloring). Reprinted with permission from ref. . Copyright 2006 American Chemical Society.
Fig. 4
Fig. 4
A depiction of the active site of the farnesyl diphosphate synthase from bacteria (E. coli), which is a homodimer (the subunit in the fore-ground is purple, that in the background, which does form part of the active site cavity, in red). The trio of Mg2+ ions are shown as blue spheres labeled 1–3, dimethylallyl-S-thiolodiphosphate in yellow, and isopentenyl diphosphate in green. Asp-111 from the first aspartate-rich motif is only indicated by an asterisk for clarity. Metal ion–ligand interactions are shown as solid blue lines, while hydrogen bond interactions are shown as dotted magenta lines. Reprinted with permission from ref. . Copyright 2004 The American Society for Biochemistry and Molecular Biology.
Fig. 5
Fig. 5
A depiction of avian farnesyl diphosphate synthase showing aromatic residues (pink) that help dictate product chain length (as defined by cavity size shown as meshwork enclosure) as well as apartate-rich motifs with a bound Mg2+ (green sphere). Reprinted with permission from ref. . Copyright 1996 National Academy of Sciences, USA
Fig. 6
Fig. 6
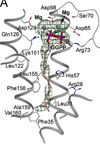
A depiction of bound GGPP in the active site of the human GGPP synthase demonstrating binding of the diphosphate to Mg2+ ions in the allylic diphosphate site. Reprinted with permission from ref. . Copyright 2006 The American Society for Biochemistry and Molecular Biology.
Fig. 7
Fig. 7
A depiction of the product chain length determinants for the octaprenyl diphosphate synthase from Thermotoga maritima. Shown are the aspartate-rich motifs as well as various residues that impact product chain length (as indicated on the side). Reprinted with permission from ref. . Copyright 2004 American Chemical Society.
Fig. 8
Fig. 8
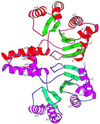
A depiction of the undecaprenyl diphosphate synthase from Escherichia coli (ribbon diagram) as an example of the distinct fold exhibited by cis-prenyl transferases. Reprinted with permission from ref. . Copyright 2001 The American Society for Biochemistry and Molecular Biology.
Fig. 9
Fig. 9
A depiction of the human squalene synthase, with comparison to FPP synthase, including location of asparate-rich motifs (as indicated). Reprinted with permission from ref. . Copyright 2000 The American Society for Biochemistry and Molecular Biology.
Fig. 10
Fig. 10
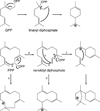
A mechanistic scheme for the biosynthesis of irregularly coupled isoprenoid diphosphates, with comparison to trans-prenylelongation. Reprinted with permission from Science, ref. . Copyright 2007 American Association for the Advancement of Science.
Fig. 11
Fig. 11
A scheme of representative mono- and sesqui- terpene cyclization reactions.
Fig. 12
Fig. 12
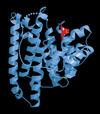
A depiction of pentalenene synthase as shown in the original report (reprinted with permission from Science, ref. 45), with only the DDxxD motif corresponding to the first aspartate-rich motif of the trans-isoprenyl diphosphate synthases highlighted in red. Copyright 1997 American Association for the Advancement of Science.
Fig. 13
Fig. 13
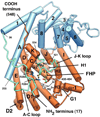
A depiction of the complex of epi-aristolochene synthase with farnesyl hydroxyphosphonate (FHP), as well as trio of Mg2+. The C-terminal class I terpenoid synthase domain is shown in orange, while the N-terminal domain commonly found in plant class I terpene synthases is shown in blue. Reprinted with permission from Science, ref. . Copyright 1997 American Association for the Advancement of Science.
Fig. 14
Fig. 14
The proposed cyclization mechanism for epi-aristolochene synthase.
Fig. 15
Fig. 15
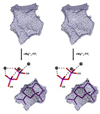
A stereoview of the active site cavity (meshwork enclosure) from aristolochene synthase in the absence and presence of ligands (Mg2+3-PPi only), demonstrating the highly complementary nature of this to the product, which is modeled into the remaining space (with Mg2+3-PPi also shown for clarity). Reprinted with permission from ref. . Copyright 2007 American Chemical Society.
Fig. 16
Fig. 16
A structural overlay of bornyl diphosphate synthase structures determined with various ligands demonstrating the invariant location of the trio of Mg2+ and, hence diphosphate group. Reprinted with permission from ref. . Copyright 2002 National Academy of Sciences, USA
Fig. 17
Fig. 17
The reaction catalyzed by bornyl diphosphate synthase, along with depiction of the relative configuration of aza-analogs of early and late stage reaction intermediates to the Mg2+3-pyrophosphate complex found in the various co-crystal structures, demonstrating the dominant effect of aza-pyrophosphate ion-pairing on binding. Reprinted from ref. .
Fig. 18
Fig. 18
Cineole synthase. A) A scheme of catalyzed reactions, both the production of cineole as well as sabinine. B) A depiction of the active site of cineole synthase showing the water molecule suggested to be added in the course of the catalyzed reaction, along with 3-aza-2,3-dihydrogeranyl diphosphate substrate analog (from a bornyl diphosphate synthase structure), as well as important Asn residue. Reprinted with permission from ref. . Copyright 2007 The American Society for Plant Biology.
Fig. 19
Fig. 19
A superposition of isoprene (hemiterpene) and bornyl diphosphate (monoterpene) synthase active site cavities, demonstrating the reduced size of the isoprene synthase (attributed to a pair of Phe). Reprinted with permission from ref. . Copyright 2011 Elsevier.
Fig. 20
Fig. 20
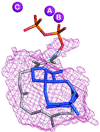
A depiction of the active site cavity for taxadiene synthase (meshwork enclosure) with bound fluorogeranylgeranyl diphosphate substrate analog (grey) and one of the potential orientations for the taxadiene product (blue). Reprinted by permission from Macmillan Publishers Ltd: Nature, ref. , copyright 2011.
Fig. 21
Fig. 21
Abietadiene synthase. A) A scheme for the class I reactions catalyzed by the wild-type (with Ala) or mutant (Ser) enzyme. B) A depiction of the sandaracopimaradiene product of mutant enzyme docked into the active site cavity along with modeled pyrophosphate-Mg2+3 co-product, also shown is the side chain of the key alanine residue. Adapted from ref. .
Fig. 22
Fig. 22
Squalene-hopene cyclase. A) A scheme for the catalyzed reaction. B) A depiction of the structure determined with anti-cholesterol drug Ro 48–8071. Reprinted with permission from ref. . Copyright 2002 Elsevier.
Fig. 23
Fig. 23
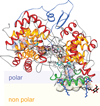
A depiction of the human lanosterol synthase with anti-cholesterol drug Ro 48–8071 bound in the active site (central cavity – defined by meshwork enclosure). Also shown is a potential orientation in the membrane (polar region is light blue and hydrophobic region, light yellow). Reprinted by permission from Macmillan Publishers Ltd: Nature, ref. , copyright 2004.
Fig. 24
Fig. 24
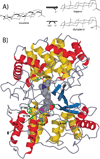
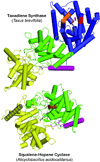
A comparison of taxadiene synthase structure with that of squalene-hopene cyclase. Structurally homologous domains are indicated by identical coloring (green and yellow), with N-terminal helix that forms part of the β domain highlighted in pink, and membrane associated helix in the squalene-hopene cyclase highlighted by grey stripes. Reprinted by permission from Macmillan Publishers Ltd: Nature, ref. , copyright 2011.
Fig. 25
Fig. 25
A close-up view of the class II active site of abietadiene synthase showing the aspartates of the DxDD motif and interacting Asn.
Fig. 26
Fig. 26
A structural comparison of (sesqui)terpene synthases with FPP synthase highlighting conservation of the class I terpenoid synthase fold (blue). Reprinted with permission from ref. . Copyright 2000 The American Society for Biochemistry and Molecular Biology.
Fig. 27
Fig. 27
A principal component analysis of the all the known class I terpenoid synthase folds. Blue, red, green and purple represent those enzymes from animal, bacteria, fungi and plant, respectively. Where available, both ligand-free and ligand-bound structures are shown, whereas for other terpene synthase structure, only one representative structure was analyzed. All structures were aligned to FPP synthase structure (PDB ID 1FPS) and coordinates of C-alpha atom from all structural equivalent residues served as input for principal component analysis. The projection of each structure onto a plane composed by principal motion 1 (PC1) and principal motion 2 (PC2), which accounted for 70% and 10% of the observed variability, respectively, are depicted below. These are derived from PDB entries 1FPS and 1YV5 for FPP synthase from animal, 1EZF for squalene synthase from animal, 1PS1 for pentalene synthase from bacteria, 1RTR and 1RQI for FPP synthase from bacteria, 1V4E for octaprenyl pyrophosphate synthase from bacteria, 2AZJ for hexaprenyl diphosphate synthase from Sulfolobus solfataricus (bacteria), 3AQB for hexaprenyl diphosphate synthase from Micrococcus luteus (bacteria), 3KBK and 3KB9 for epi-isozizaene synthase from bacteria, 1JFA and 1JFG for trichodiene synthase from fungi, 2DH4 for GGPP synthase from fungi, 2E4O and 2OA6 for aristolochene synthase from fungi, 1N1B and 1N20 for bornyl disphosphate synthase from plant, 2J1O for GGPP synthase from plant, 2J5C for 1,8-cineole synthase from plant, 2ONG for limonene synthase from plant, 3APZ and 3AQ0 for GPP synthase from plant, 3G4D and 3G4F for delta-cadinene synthase from plant, 3N0F and 3N0G for isoprene synthase from plant, 3P5P for taxadiene synthase from plant, 3S9V for abietadiene synthase from plant, 3SAE and 3SDQ for alpha-bisabolene synthase from plant, 5EAS and 5EAT for 5-epi-aristolochene synthase from plant.
Fig. 28
Fig. 28
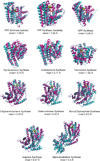
A comparison of class I terpenoid synthases that have had both unliganded and ligand-bound structures determined. The depicted enzymes are indicated along with the RMSD for the overlaid structures. Cyan represents the ligand-free and magenta represents the ligand bound structures of each. Substrate/product/pyrophosphate and their analogs are shown in thick lines and magnesium are shown as spheres. The PDB ID are 1FPS and 1YV5 for FPP synthase from animal, 1RTR and 1RQI for FPP synthase from bacteria, 3APZ and 3AQ0 for GPP synthase, 3KBK and 3KB9 for epi-isozizaene synthase, 2E4O and 2OA6 for aristolochene synthase, 1JFA and 1JFG for trichodiene synthase, 5EAS and 5EAT for 5-epi-aristolochene Synthase, 3G4D and 3G4F for deltacadinene synthase, 1N1B and 1N20 for bornyl disphosphate synthase, 3N0F and 3N0G for isoprene synthase, 3SAE and 3SDQ for alpha-bisabolene synthase.

Similar articles

Cited by

References

    1. Croteau R, Kutchan TM, Lewis NG. In: Biochemistry & Molecular Biology of Plants. Buchanan B, Gruissem W, Jones R, editors. Rockville, MD, USA: Am. Soc. Plant Biologists; 2000. pp. 1250–1318.
    1. Christianson DW. Curr. Opin. Chem. Biol. 2008;12:141–150. - PMC - PubMed
    1. Wendt KU, Schulz GE. Structure. 1998;6:127–133. - PubMed
    1. Cao R, Zhang Y, Mann FM, Huang C, Mukkamala D, Mudock MP, Mead ME, Prisic S, Wang K, Lin K-Y, Chang T-K, Peters RJ, Oldfield E. Proteins: Struct., Funct., Bioinf. 2010;78:2417–2432. - PMC - PubMed
    1. Köksal M, Jin Y, Coates RM, Croteau R, Christianson DW. Nature. 2011;469:116–120. - PMC - PubMed

Publication types

MeSH terms