. 2012 Oct;31(10):1941-54.
doi: 10.1109/TMI.2012.2210558. Epub 2012 Aug 13.

GLISTR: glioma image segmentation and registration

Affiliations

GLISTR: glioma image segmentation and registration

Ali Gooya et al. IEEE Trans Med Imaging. 2012 Oct.

Abstract

We present a generative approach for simultaneously registering a probabilistic atlas of a healthy population to brain magnetic resonance (MR) scans showing glioma and segmenting the scans into tumor as well as healthy tissue labels. The proposed method is based on the expectation maximization (EM) algorithm that incorporates a glioma growth model for atlas seeding, a process which modifies the original atlas into one with tumor and edema adapted to best match a given set of patient's images. The modified atlas is registered into the patient space and utilized for estimating the posterior probabilities of various tissue labels. EM iteratively refines the estimates of the posterior probabilities of tissue labels, the deformation field and the tumor growth model parameters. Hence, in addition to segmentation, the proposed method results in atlas registration and a low-dimensional description of the patient scans through estimation of tumor model parameters. We validate the method by automatically segmenting 10 MR scans and comparing the results to those produced by clinical experts and two state-of-the-art methods. The resulting segmentations of tumor and edema outperform the results of the reference methods, and achieve a similar accuracy from a second human rater. We additionally apply the method to 122 patients scans and report the estimated tumor model parameters and their relations with segmentation and registration results. Based on the results from this patient population, we construct a statistical atlas of the glioma by inverting the estimated deformation fields to warp the tumor segmentations of patients scans into a common space.


Figures
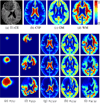
Fig. 1
Fig. 1
(a) Sample glioma scan, (b)–(d) healthy cerebro spinal fluid, gray matter and white matter probability maps, evolution of the corresponding probability maps of (e) tumor, (f) edema, (g) cerebro spinal fluid, and (h) gray matter (i) white matter at t ≃ 0 (right after initial condition), t = T/2, and t = T, computed by the proposed method.
Fig. 2
Fig. 2
(a) Minimization of the total cost (defined as the negative of Q in the M-Step) for eight different initial seed points. Initial variations of the cost correspond to updates in q (with h and Φ fixed) whereas the large drops correspond to first round of convergence and update in h (with q fixed), (b) enlargement of the second and third rounds of optimization with minor changes of the cost, showing the convergence.
Fig. 3
Fig. 3
(a)–(b) Slices of FLAIR and T2 modalities, (c) the corresponding slice of the reference segmentations from our clinician expert, (d)–(k) the corresponding final segmentations acquired with GLISTR for eight different initial seed points (S.1–S.8 in Fig. 2). Except for S.4, all other segmentations look reasonably similar to the references in (c). This shows that the method is relatively robust to changes in initial seed location.
Fig. 4
Fig. 4
Comparison of segmentations obtained from various raters. Each row corresponds to a single patient: FLAIR and T1-CE modalities are shown in columns (a) and (b), followed by segmentations of Expert1, Expert2, the proposed method (GLISTR), methods proposed in [22] and [14] (SVM) in columns (c)–(g) respectively. Comparison of (c) to (d) reveals the inter-rater variability of the segmentations (e.g., compare second row from bottom; a larger tumor volume has been delineated by Expert2). Many necrotic regions are not segmented as tumor by [22], whereas a lot of false-tumor positives are observable in SVM results. The proposed GLISTR method, however, has the most resemblance to the results of Expert1 considered as the reference volumes in this study.
Fig. 5
Fig. 5
Error bar graphs of the measured Dice scores for the segmented labels for various raters, the second human rater (RATER), the proposed method (GLISTR), method of [22], and SVM based method [14], with regard to the first rater as the ground truth. On tumor and edema labels GLISTR outperforms these methods and reaches a similar accuracy of the second clinical expert.
Fig. 6
Fig. 6
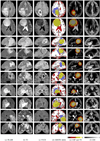
Segmentation and registration results for 10 sample patients. Each row corresponds to a single patient and represents the results in the slice with largest tumor section. (a)–(c) FLAIR, T2 and T1-CE images, (d) segmentation results of GLISTR showing enhancing tumor, necrosis, edema, CSF, gray and white matters in light and dark yellows, purple, red, gray and white colors respectively, (e) overlay of the tumor and CSF probability maps registered to the patient scans, (f) probability map of GM registered to the patient scans.
Fig. 7
Fig. 7
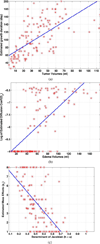
Scatter plots of the estimated tumor model parameters for the 122 glioma cases. (a) Tumor growth duration T versus the volume of the segmented tumor Vol(TU), (b) Diffusion coefficient Dw versus the volume of the segmented edema Vol(ED), (c) The average determinant of the Jacobian of the total composite deformation field |Jac(hu)| in the tumor area versus mass-effect coefficient p1 The blue line fits show the linearities in the relations of the estimated parameters. Further deviations from these lines correspond to higher degrees of the nonlinearity. Hence, the most linear relation is observed between T and Vol(TU), whereas the least linearity is observed for Dw versus Vol(ED) (see Section IV-E).
Fig. 8
Fig. 8
First row: sample T1CE images of gliomas, Second row: atlas normalized tumor posteriors overlayed on their corresponding T1CE images. Ventricles seem to be relaxed compared to the original patients scans (cf. the regions encircled by the markers).
Fig. 9
Fig. 9
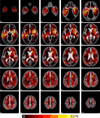
Tumor atlas indicating the spatial probability distribution of tumor on the atlas space. We mapped the posterior probability of tumors back to the atlas space by inverting the total deformation field (hu)−1. Then we computed the average of these transformed tumor posteriors over 122 glioma cases. The color bar indicates that, within our patient population, the region with the highest tumor probability is placed in the left temporal lobe of the brain.
Fig. 10
Fig. 10
Spatial distribution of the estimated tumor seeds for 122 glioma cases in the atlas space indicated from: (a) sagital, (b) coronal, (c) axial, and (d) 3-D views. The colors distinguish the spatial location of each tumor seed in different views. Fewer seeds are located in the frontal and occipital lobes compared to other regions of the brain.

References

    1. Collins V. Gliomas. Cancer Survey. 1998;32:37–51. - PubMed
    1. Markert J, Devita V, Rosenberg S, Hellman S. Gliobalastoma Multiforme. Burlington, MA: Jones Bartlett; 2005.
    1. Weizman L, Sira L, Joskowicz L, Constantini S, Precel R, Shortly B, Bashat D. Automatic segmentation, internal classification, and follow-up of optic pathway gliomas in MRI. Med. Image Anal. 2012;16:177–188. - PubMed
    1. Liu J, Udupa J, Odhner D, Hackney D, Moonis G. A system for brain tumor volume estimation via MR imaging and fuzzy connectedness. Comput. Med. Imag. Graphics. 2005;29:21–34. - PubMed
    1. Henson J, Ulmer S, Harris G. Brain tumor imaging in clinical trials. Am. J. Neuroradiol. 2008;29:419–424. - PMC - PubMed

Publication types