. 2012 Aug 10:6:31.
doi: 10.3389/fnana.2012.00031. eCollection 2012.

Resting state cortico-cerebellar functional connectivity networks: a comparison of anatomical and self-organizing map approaches

Affiliations

Resting state cortico-cerebellar functional connectivity networks: a comparison of anatomical and self-organizing map approaches

Jessica A Bernard et al. Front Neuroanat. .

Abstract

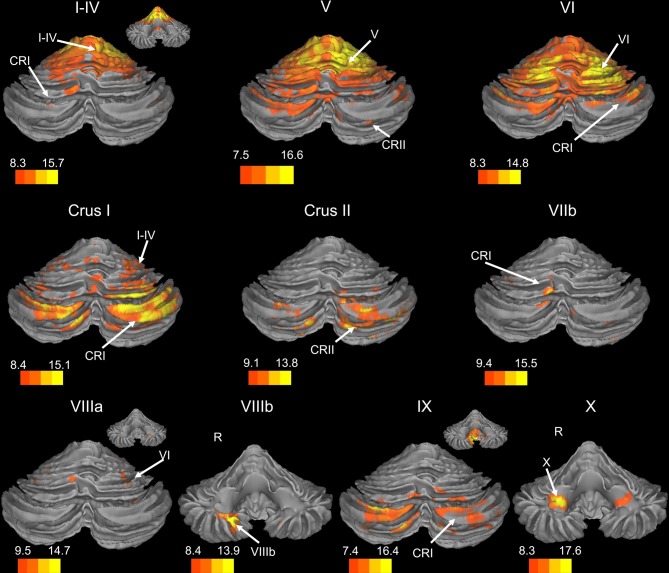
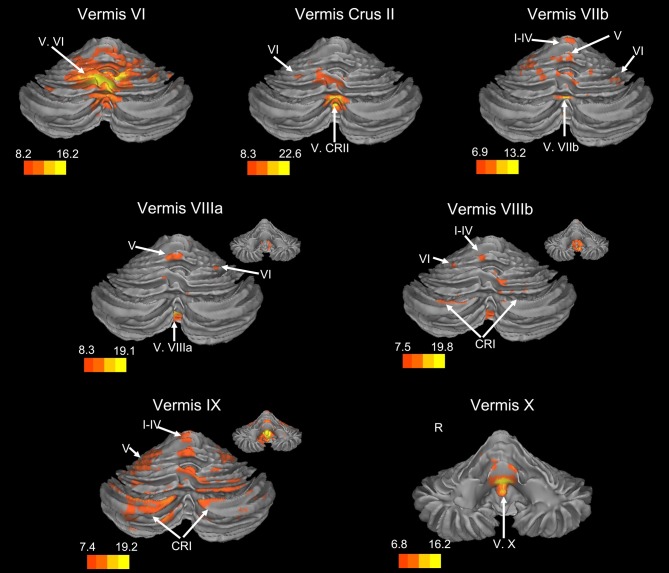
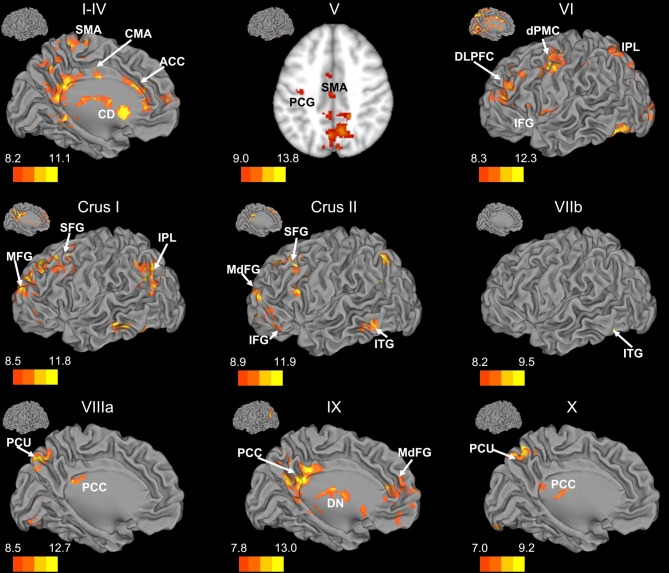
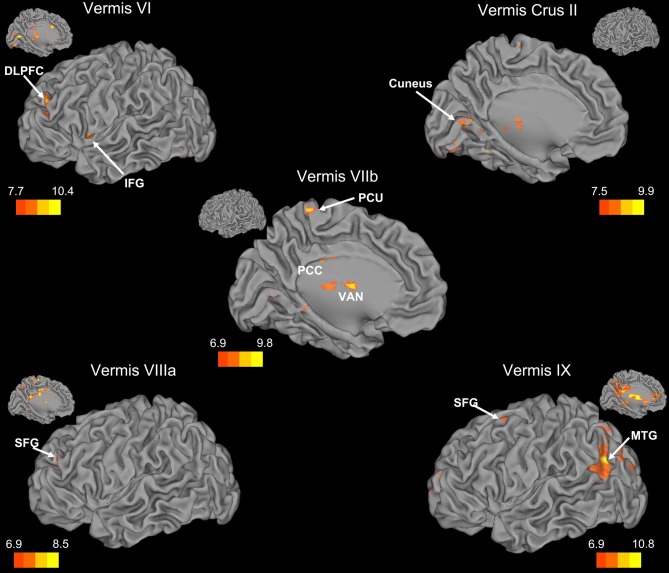
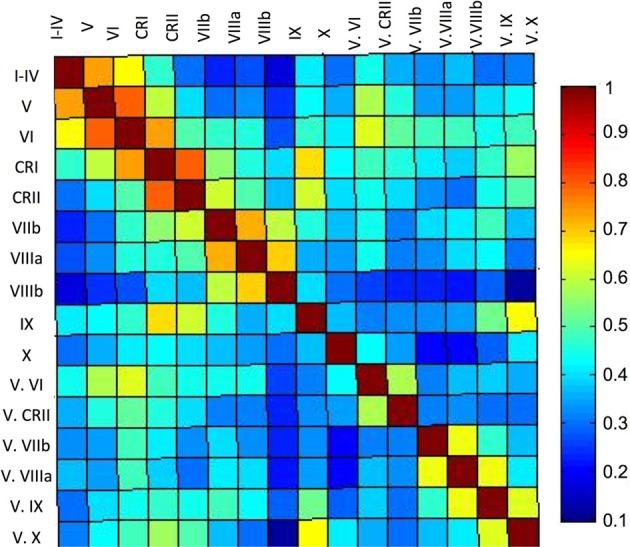
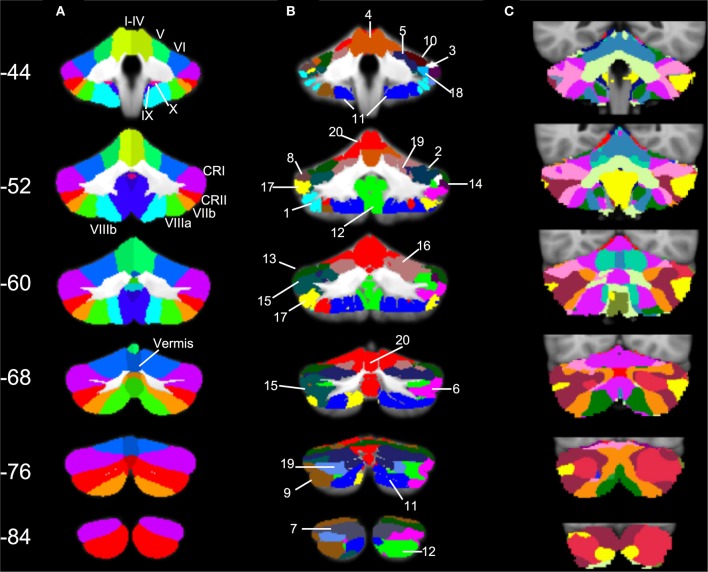
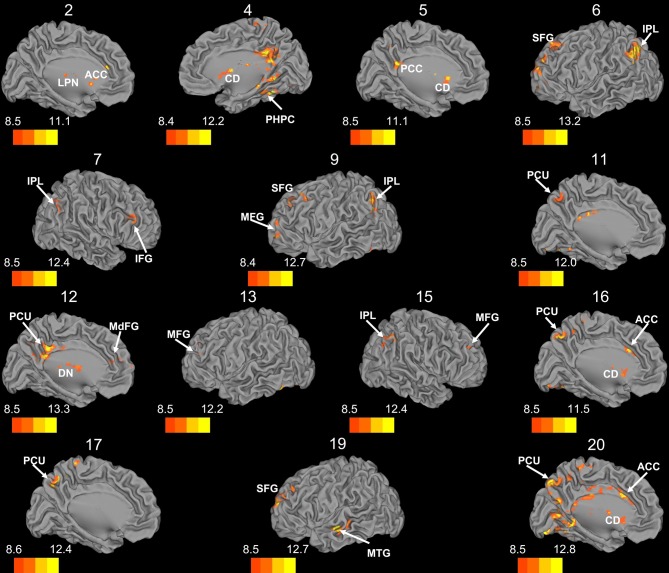
The cerebellum plays a role in a wide variety of complex behaviors. In order to better understand the role of the cerebellum in human behavior, it is important to know how this structure interacts with cortical and other subcortical regions of the brain. To date, several studies have investigated the cerebellum using resting-state functional connectivity magnetic resonance imaging (fcMRI; Krienen and Buckner, 2009; O'Reilly et al., 2010; Buckner et al., 2011). However, none of this work has taken an anatomically-driven lobular approach. Furthermore, though detailed maps of cerebral cortex and cerebellum networks have been proposed using different network solutions based on the cerebral cortex (Buckner et al., 2011), it remains unknown whether or not an anatomical lobular breakdown best encompasses the networks of the cerebellum. Here, we used fcMRI to create an anatomically-driven connectivity atlas of the cerebellar lobules. Timecourses were extracted from the lobules of the right hemisphere and vermis. We found distinct networks for the individual lobules with a clear division into "motor" and "non-motor" regions. We also used a self-organizing map (SOM) algorithm to parcellate the cerebellum. This allowed us to investigate redundancy and independence of the anatomically identified cerebellar networks. We found that while anatomical boundaries in the anterior cerebellum provide functional subdivisions of a larger motor grouping defined using our SOM algorithm, in the posterior cerebellum, the lobules were made up of sub-regions associated with distinct functional networks. Together, our results indicate that the lobular boundaries of the human cerebellum are not necessarily indicative of functional boundaries, though anatomical divisions can be useful. Additionally, driving the analyses from the cerebellum is key to determining the complete picture of functional connectivity within the structure.

Keywords: cerebellum; resting state functional connectivity; self-organizing map.


Figures

Figure 1
Figure 1
Resting state connectivity of right hemisphere lobules within the cerebellum. The color bars correspond to the colored shading and are indicative of the t-values at each region. The maps are thresholded such that only significant results are presented. In several cases, insets are provided to show the extent of the connectivity maps. In all cases, the right is presented on the right, and the left on the left side, except for the inferior views of the cerebellum. Here, the right hemisphere is presented on the left side and indicated by an “R.” CRI, Crus I; CRII, Crus II.
Figure 2
Figure 2
Resting state connectivity of the cerebellar vermis within the cerebellum. The color bars correspond to the colored shading and are indicative of the t-values at each region. The maps are thresholded such that only significant results are presented. In several cases, insets are provided to show the extent of the connectivity maps. In all cases, the right is presented on the right, and the left on the left side, except for the inferior views of the cerebellum. Here, the right hemisphere is presented on the left side and indicated by an “R.” CRI, Crus I; CRII, Crus II.
Figure 3
Figure 3
Resting state cerebello-cortical connectivity maps of the right cerebellar hemisphere. Whole-brain networks of the cerebellar lobules are displayed. The cross-laterality of the cerebellum resulted in networks largely in the left hemisphere from right cerebellar seeds. As such, we present only this hemisphere. Because of the location of the primary correlations with lobule V, a slice has been presented (z = 43). The color bars correspond to the colored shading and are indicative of the t-values at each region. The maps are thresholded such that only significant results are presented. Lobule VIIIb did not show any correlations with the whole brain and has therefore not been included here. CD, caudate; dPMC, dorsal pre-motor cortex; DLPFC, dorsolateral prefrontal cortex; DN, dorsomedial nucleus of the thalamus; IFG, inferior frontal gyrus; IPL, inferior parietal lobule; ITG, inferior temporal gyrus; MFG, middle frontal gyrus; MdFG, medial frontal gyrus; PCC, posterior cingulate cortex; PCU, precuneus; SFG, superior frontal gyrus; SMA, supplementary motor area.
Figure 4
Figure 4
Resting state cerebello-cortical connectivity maps of the cerebellar vermis. Whole-brain networks of the cerebellar vermis are displayed on the left hemisphere. The color bars correspond to the colored shading and are indicative of the t-values at each region. Insets provide the additional view of the left hemisphere. The maps are thresholded such that only significant results are presented. Vermis X did not show any correlations with the whole brain and has therefore not been included here. DLPFC, dorsolateral prefrontal cortex; MTG, middle temporal gyrus; PCC, posterior cingulate cortex; PCU, precuneus; SFG, superior frontal gyrus; VAN, ventral anterior nucleus of the thalamus.
Figure 5
Figure 5
Correlation matrix of the lobules of the right cerebellar hemisphere and vermis. The correlation matrix based on the average timecourses of the lobules of the right hemisphere and vermis indicates primarily local correlations, with some cases of correlations across greater distances, perhaps based on functional similarities. The color bar indicates the r-values presented in the matrix.
Figure 6
Figure 6
SOM results in comparison to cerebellar anatomy and cerebellar parcellation based on cortical networks. (A) Anatomical masks from the SUIT atlas, with labeled lobules (Diedrichsen, ; Diedrichsen et al., 2009) used in our lobular analyses overlaid on the SUIT cerebellum. (B) The twenty clusters from our SOM algorithm overlaid onto the SUIT cerebellum. The numbers correspond to the clusters as described in Table 5. (C) The 17-network cortical solution in the cerebellum (from Buckner et al., 2011). Coronal slices from anterior (Y = −44) to posterior (Y = −84).
Figure 7
Figure 7
Whole brain connectivity of the self-organizing map clusters. Results are presented on the left hemisphere, with the exception of clusters 4, 7, and 15, which are presented on the right. Clusters 2, 4, 5, 6, 11, 12, 16, 17, and 20 are medial views. Clusters 3, 8, 14, and 18 did not show suprathreshold clusters, while clusters 1 and 10 were only correlated with regions of the cerebellum, so these maps are not included. The color bars correspond to the colored shading and are indicative of the t-values at each region. The maps are thresholded such that only significant results are presented. MFG, middle frontal gyrus; MdFG, medial frontal gyrus; IPL, inferior parietal lobule; SFG, superior frontal gyrus; ACC, anterior cingulate; PCC, posterior cingulate; PCU, precuneus; SMA, supplementary motor area; MPFC, medial prefrontal cortex; CD, caudate; LPN, lateral posterior nucleus of the thalamus; MTG, middle temporal gyrus.

Similar articles

Cited by

References

    1. Allen G., McColl R., Barnard H., Ringe W. K., Fleckenstein J., Cullum C. M. (2005). Magnetic resonance imaging of cerebellar-prefrontal and cerebellar-parietal functional connectivity. Neuroimage 28, 39–48 10.1016/j.neuroimage.2005.06.013 - DOI - PubMed
    1. Apps R., Hawkes R. (2009). Cerebellar cortical organization: a one-map hypothesis. Nat. Rev. Neurosci. 10, 670–681 10.1038/nrn2698 - DOI - PubMed
    1. Avants B. B., Epstein C. L., Grossman M., Gee J. C. (2008). Symmetric diffeomorphic image registration with cross-correlation: evaluating automated labeling of elderly and nerodegenerative brain. Med. Image Anal. 12, 26–41 10.1016/j.media.2007.06.004 - DOI - PMC - PubMed
    1. Beckmann C. F., DeLuca M., Devlin J. T., Smith S. S. (2005). Investigations into resting-state connectivity using independent component analysis. Philos. Trans. R. Soc. Lond. B Biol. Sci. 360, 1001–1013 10.1098/rstb.2005.1634 - DOI - PMC - PubMed
    1. Biswal B., Mennes M., Zuo X.-N., Gohel S., Kelly C., Smith S. M., Beckmann C. F., Adelstein J. S., Buckner R. L., Colcombe S., Dogonowski A.-M., Ernst M., Fair D., Hampson M., Hoptman M. J., Hyde J. S., Kiviniemi V. J., Kötter R., Li S.-J., Lin C.-P., Lowe M. J., Mackay C., Madden D. J., Madsen K. H., Margulies D. S., Mayberg H. S., McMahon K., Monk C. S., Mostofsky S. H., Nagel B., Pekar J. J., Peltier S. J., Petersen S. E., Riedl V., Rombouts S. A. R. B., Rympa B., Schlaggar B. L., Schmidt S., Seidler R. D., Siegle G. J., Sorg C., Teng G.-J., Veijola J., Villringer A., Waler M., Wang L., Weng X.-C., Whitfield-Gabrieli S., Williamson P., Windischberger C., Zang Y.-F., Zhang H.-Y., Castellanos F. X., Milham M. P. (2010). Toward discovery science of human brain function. Proc. Natl. Acad. Sci. U.S.A. 107, 4734–4739 10.1073/pnas.0911855107 - DOI - PMC - PubMed