. 2012 Aug 10:3:293.
doi: 10.3389/fmicb.2012.00293. eCollection 2012.

Millimeter-scale patterns of phylogenetic and trait diversity in a salt marsh microbial mat

Affiliations

Millimeter-scale patterns of phylogenetic and trait diversity in a salt marsh microbial mat

David W Armitage et al. Front Microbiol. .

Abstract

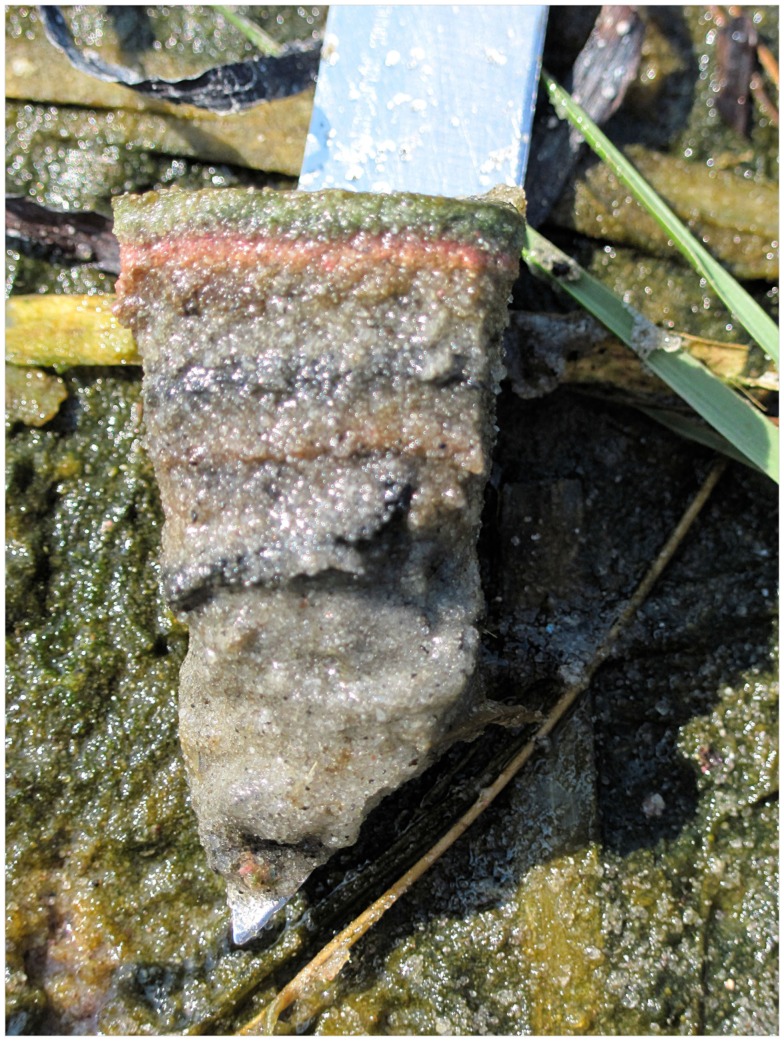
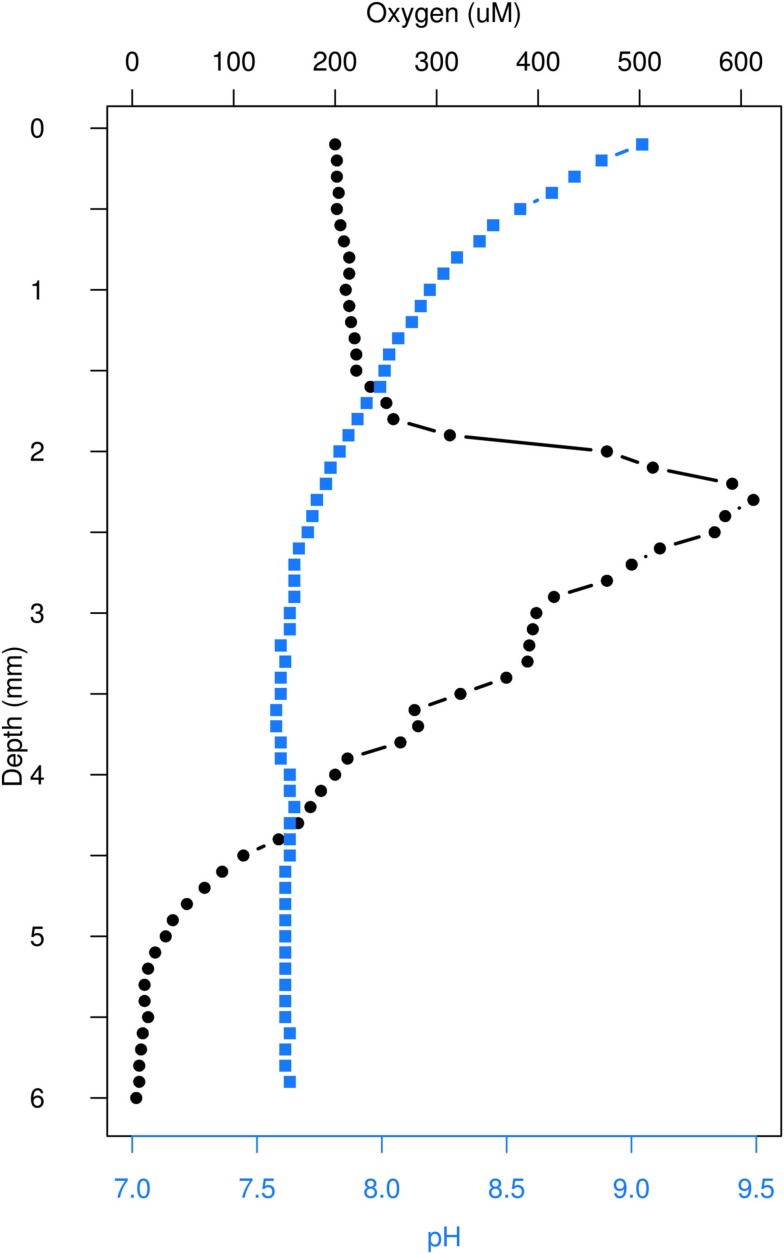
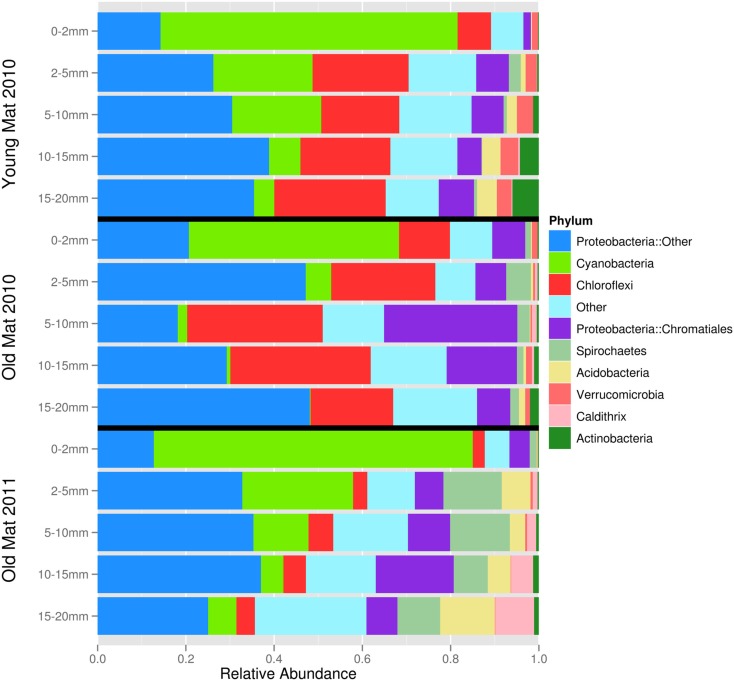
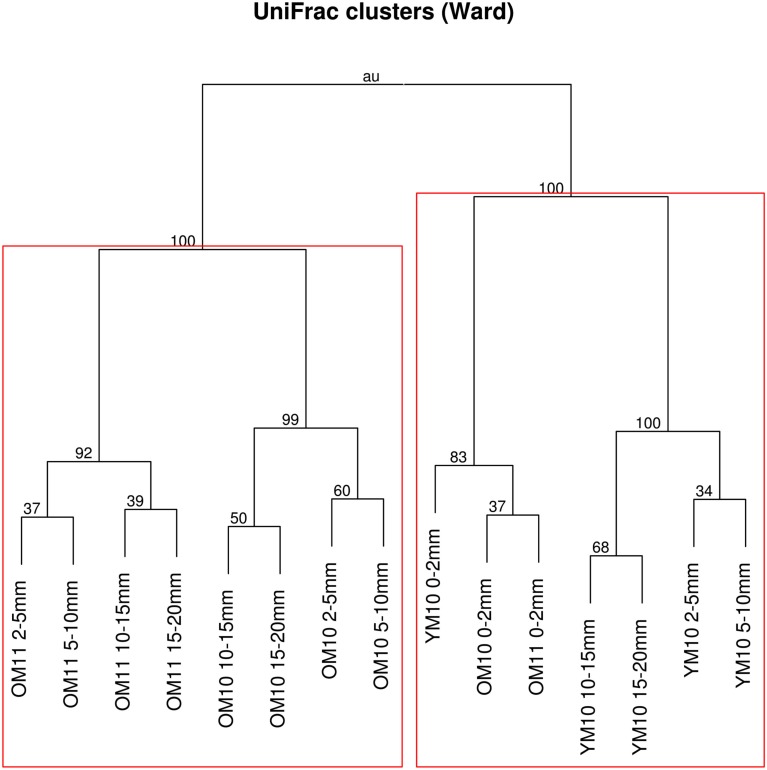
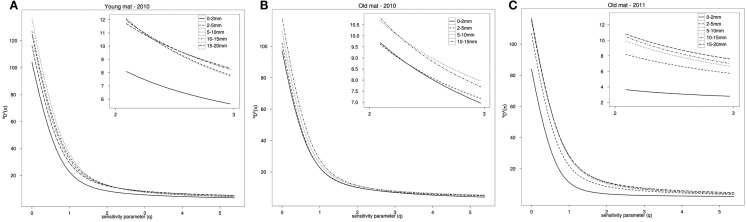
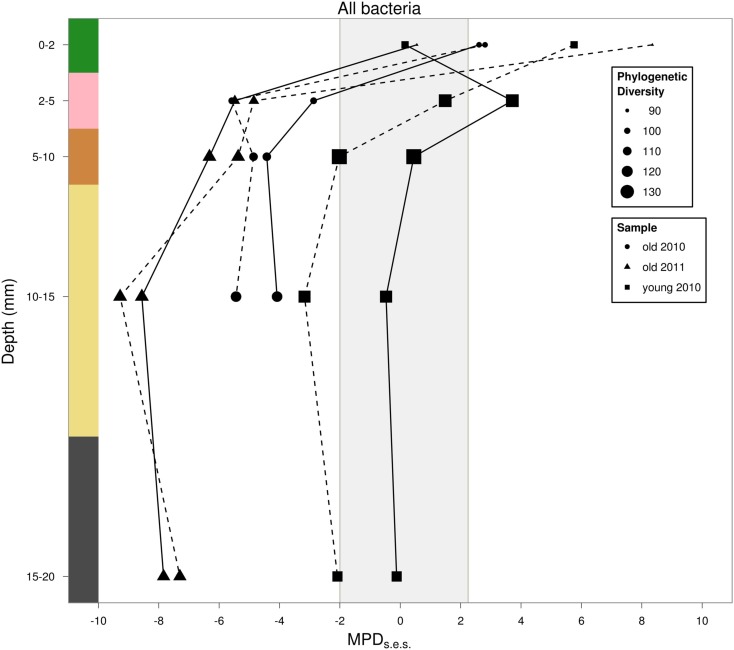
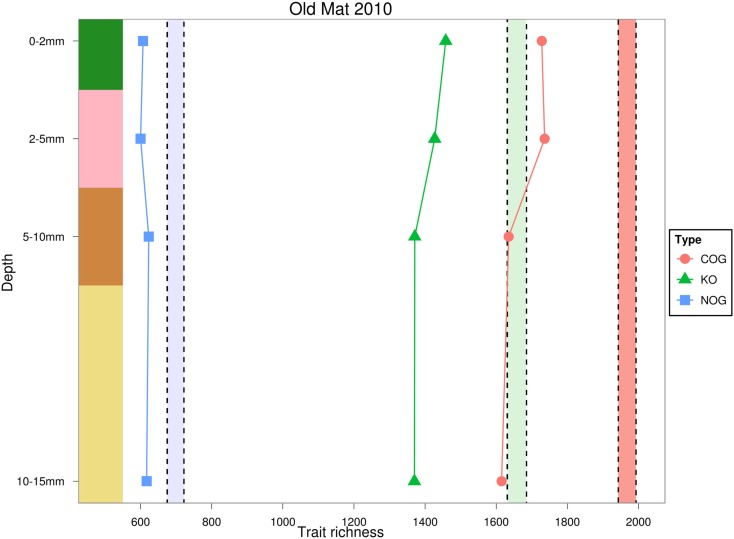
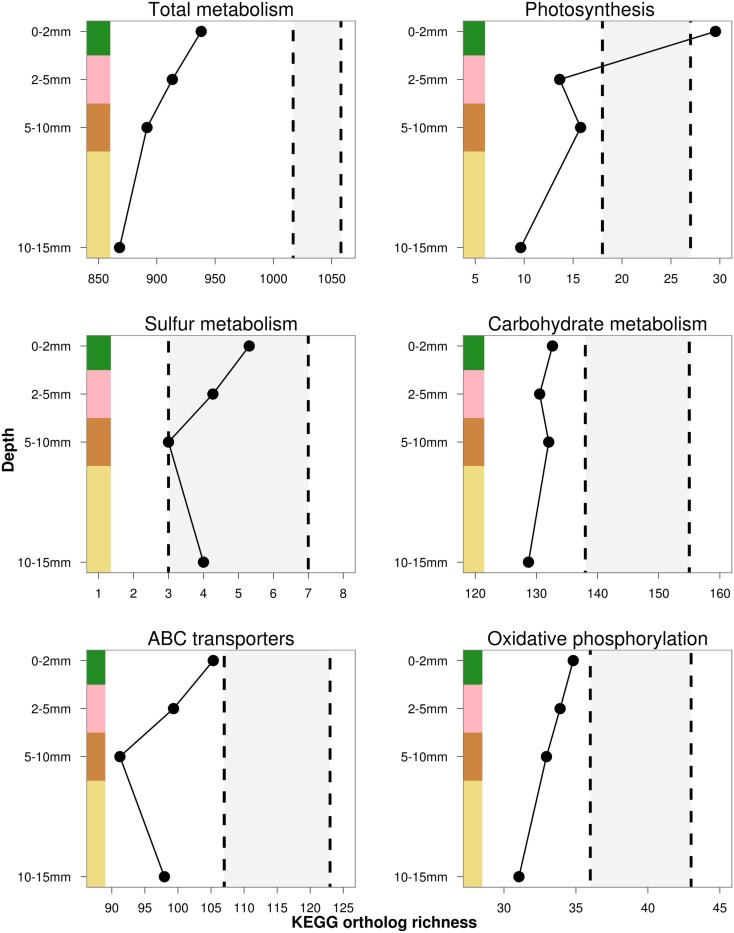
Intertidal microbial mats are comprised of distinctly colored millimeter-thick layers whose communities organize in response to environmental gradients such as light availability, oxygen/sulfur concentrations, and redox potential. Here, slight changes in depth correspond to sharp niche boundaries. We explore the patterns of biodiversity along this depth gradient as it relates to functional groups of bacteria, as well as trait-encoding genes. We used molecular techniques to determine how the mat's layers differed from one another with respect to taxonomic, phylogenetic, and trait diversity, and used these metrics to assess potential drivers of community assembly. We used a range of null models to compute the degree of phylogenetic and functional dispersion for each layer. The SSU-rRNA reads were dominated by Cyanobacteria and Chromatiales, but contained a high taxonomic diversity. The composition of each mat core was significantly different for developmental stage, year, and layer. Phylogenetic richness and evenness positively covaried with depth, and trait richness tended to decrease with depth. We found evidence for significant phylogenetic clustering for all bacteria below the surface layer, supporting the role of habitat filtering in the assembly of mat layers. However, this signal disappeared when the phylogenetic dispersion of particular functional groups, such as oxygenic phototrophs, was measured. Overall, trait diversity measured by orthologous genes was also lower than would be expected by chance, except for genes related to photosynthesis in the topmost layer. Additionally, we show how the choice of taxa pools, null models, spatial scale, and phylogenies can impact our ability to test hypotheses pertaining to community assembly. Our results demonstrate that given the appropriate physiochemical conditions, strong phylogenetic, and trait variation, as well as habitat filtering, can occur at the millimeter-scale.

Keywords: biodiversity; community assembly; metagenomics; microbial mat; null models; phylogenetics; salt marsh.


Figures

Figure 1
Figure 1
Greater Sippewissett salt marsh microbial mat showing typical lamination (photo credit: NDY).
Figure 2
Figure 2
In situ microsensor depth profile for oxygen concentration and pH.
Figure 3
Figure 3
Phylum-level community composition for each mat layer and core sample. ‘Proteobacteria::Other’ includes orders Syntrophobacterales, Rhodospirillales, Rhodobacterales, Desulfobacterales, Campylobacterales, Oceanospirillales, Myxococcales, Desulfovibrionales, Salinisphaerales, and Rhizobiales. Phyla in “Other” category (<1% relative abundance) include Bacteroidetes, Chlamydiae, Chlorobi, Firmicutes, Fusobacteria, Gemmatimonadetes, Lentosphaerae, Nitrospirae, Planctomycetes, Tenericutes, Thermi, and candidate divisions ABY1, BRC1, GN02, GN04, GN06, GN12, HYD24-12, KSB1, LCP89, MSBL6, MVP-15, NKB19, OP8, OP9, OP11, SAR406, SC4, TG3, TM6, TM7, WPS-2, WS1, WS3, ZB2.
Figure 4
Figure 4
Dendrogram of UniFrac distances clustered using Ward’s minimum variance method. Node labels are AU p-values. Values greater than 95 indicate significant clusters. Rectangles indicate the deepest significant clusters within each clade. OM, old mat; YM, young mat; 10, 2010; 11, 2011.
Figure 5
Figure 5
Rarefied phylogenetic diversity profile, qDZ(π), for (A) the young mat sample, (B) the old mat 2010 sample, and (C) the old mat 2011 sample. Increasing parameter q decreases the metric’s sensitivity to rare taxa and becomes a measure of evenness. Inset box shows values 2 ≤ q ≤ 3.
Figure 6
Figure 6
Estimated rarefied phylogenetic dispersion with depth. Solid lines are results using taxa pool 1 (all years, all cores) as the regional pool, dashed lines are results using taxa pool 3 (individual cores) as the regional pool. Point size is scaled to phylogenetic diversity, 0DZ(π). Values falling below the shaded region indicate statistically significant phylogenetic clustering. Values above this region indicate phylogenetic overdispersion.
Figure 7
Figure 7
Estimated rarefied trait richness in the OM-10 core using three different orthologous gene annotations. Values falling below or above their similarly colored shaded regions indicate significantly fewer (α = 0.05) or greater trait richness than expected under 1,000 null model randomizations, respectively.
Figure 8
Figure 8
Estimated rarefied KEGG trait richness in the OM-10 core for a subset of functional gene categories. Values falling below or above the shaded regions indicate significantly fewer (α = 0.05) or greater trait richness than expected under 1,000 null model randomizations, respectively.

References

    1. Amaral-Zettler L. A., Zettler E. R., Theroux S. M., Palacios C., Aguilera A., Amils R. (2010). Microbial community structure across the tree of life in the extreme Río Tinto. ISME J. 5, 42–50 10.1038/ismej.2010.101 - DOI - PMC - PubMed
    1. Anderson M. J. (2001). A new method for non-parametric multivariate analysis of variance. Austral Ecol. 26, 32–46 10.1111/j.1442-9993.2001.01070.pp.x - DOI
    1. Awramik S. M. (1984). “Ancient stromatolites and microbial mats,” in Microbial Mats: Stromatolites, eds Cohen Y., Castenholz R. W., Halvoroson H. O. (New York: Alan R. Liss Inc; ), 1–22
    1. Barberán A., Casamayor E. O. (2010). Global phylogenetic community structure and β-diversity patterns in surface bacterioplankton communities. Aquat. Microb. Ecol. 59, 1–10 10.3354/ame01389 - DOI
    1. Bell T., Newman J. A., Silverman B. W., Turner S. L., Lilley A. K. (2005). The contribution of species richness and composition to bacterial services. Nature 436, 1157–1160 10.1038/nature03437 - DOI - PubMed

LinkOut - more resources