. 2012 Aug;2(8):853-64.
doi: 10.1534/g3.112.002667. Epub 2012 Aug 1.

Genome-wide association mapping in tomato (Solanum lycopersicum) is possible using genome admixture of Solanum lycopersicum var. cerasiforme

Affiliations

Genome-wide association mapping in tomato (Solanum lycopersicum) is possible using genome admixture of Solanum lycopersicum var. cerasiforme

Nicolas Ranc et al. G3 (Bethesda). 2012 Aug.

Abstract

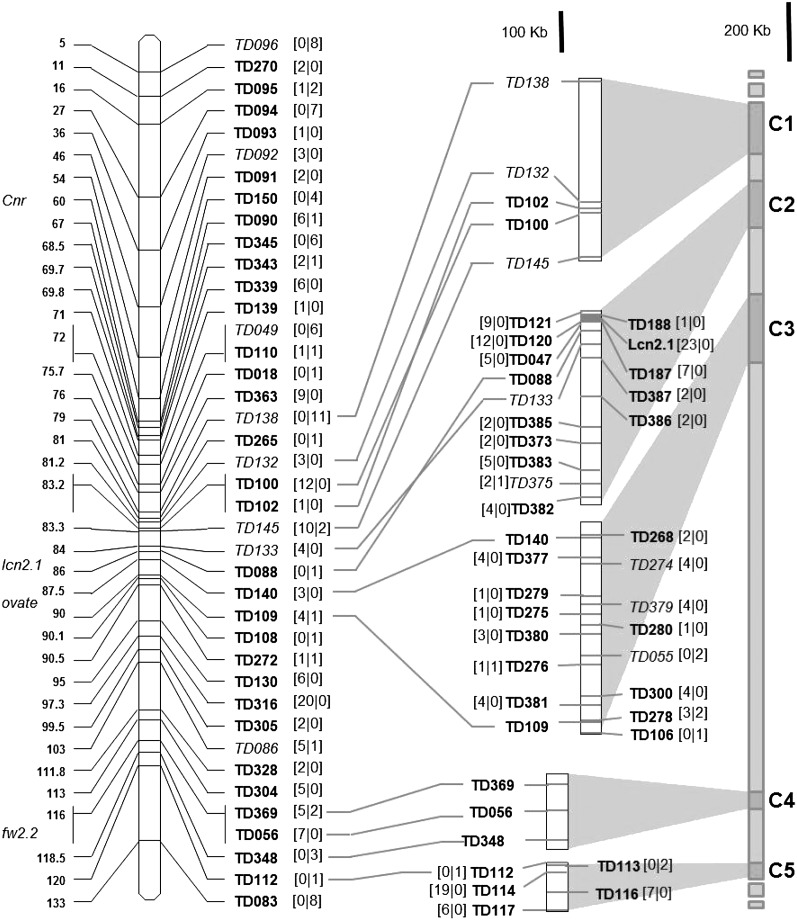
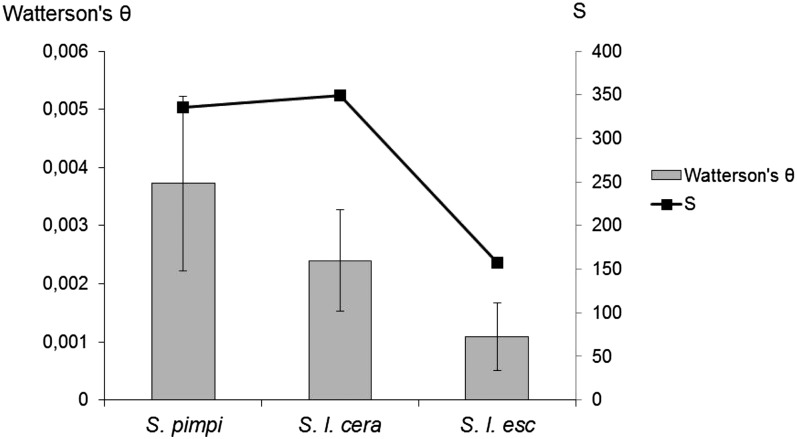
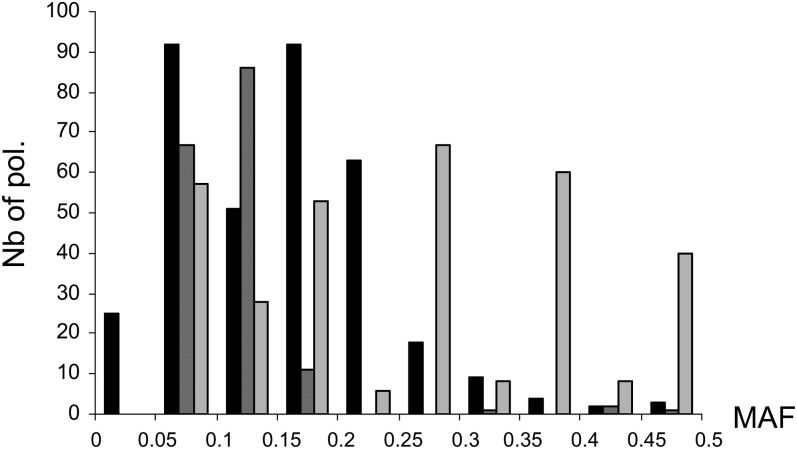
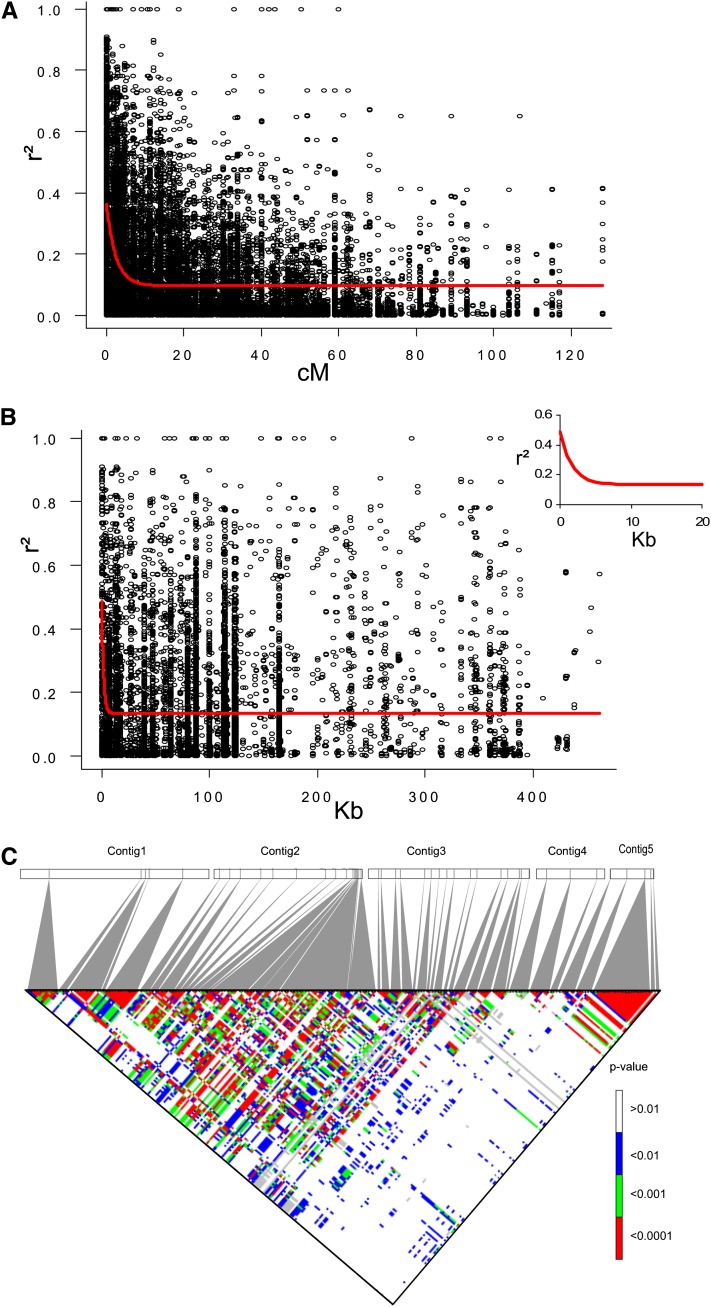
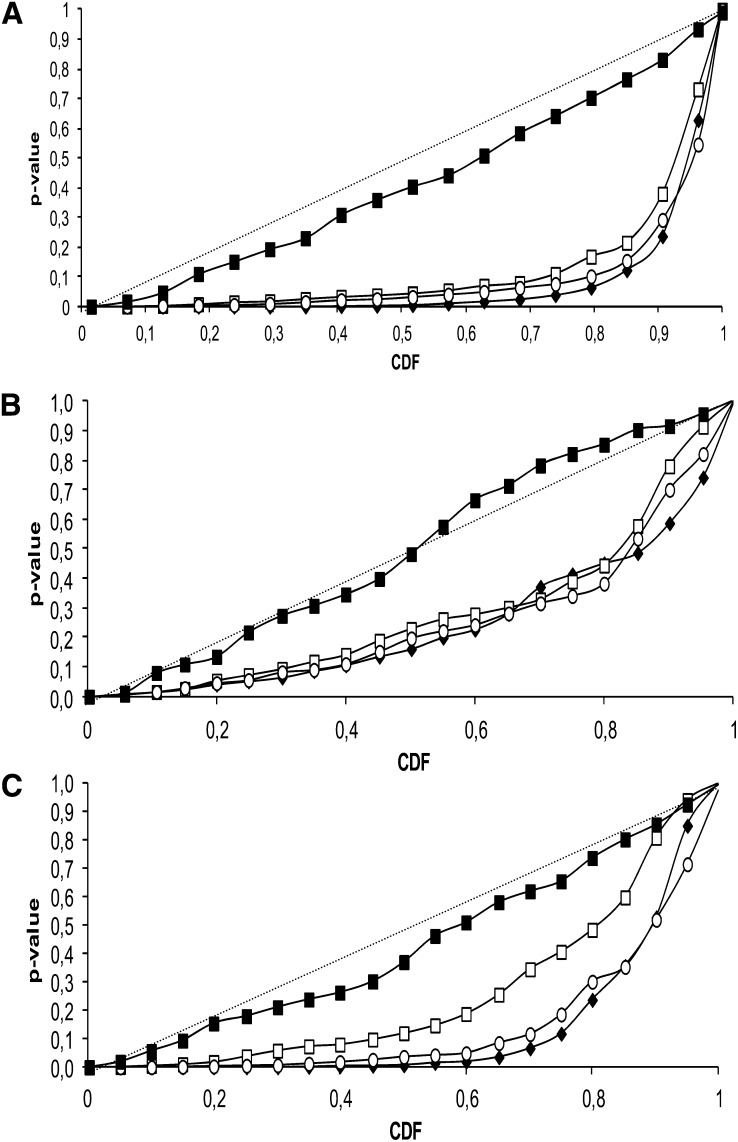
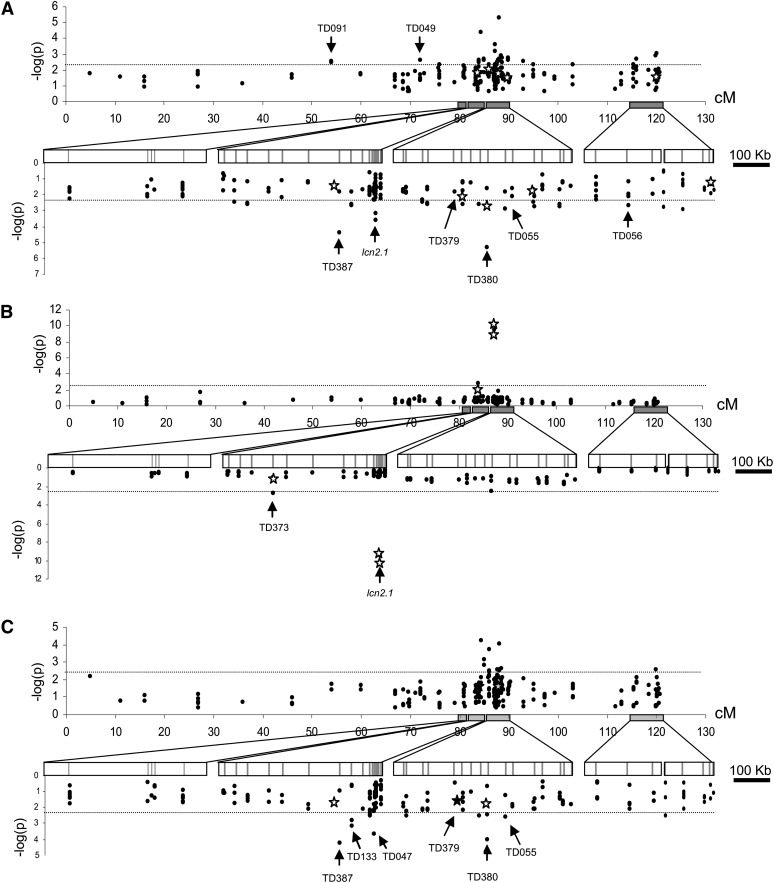
Genome-wide association mapping is an efficient way to identify quantitative trait loci controlling the variation of phenotypes, but the approach suffers severe limitations when one is studying inbred crops like cultivated tomato (Solanum lycopersicum). Such crops exhibit low rates of molecular polymorphism and high linkage disequilibrium, which reduces mapping resolution. The cherry type tomato (S. lycopersicum var. cerasiforme) genome has been described as an admixture between the cultivated tomato and its wild ancestor, S. pimpinellifolium. We have thus taken advantage of the properties of this admixture to improve the resolution of association mapping in tomato. As a proof of concept, we sequenced 81 DNA fragments distributed on chromosome 2 at different distances in a core collection of 90 tomato accessions, including mostly cherry type tomato accessions. The 81 Sequence Tag Sites revealed 352 SNPs and indels. Molecular diversity was greatest for S. pimpinellifolium accessions, intermediate for S. l. cerasiforme accessions, and lowest for the cultivated group. We assessed the structure of molecular polymorphism and the extent of linkage disequilibrium over genetic and physical distances. Linkage disequilibrium decreased under r(2) = 0.3 within 1 cM, and minimal estimated value (r(2) = 0.13) was reached within 20 kb over the physical regions studied. Associations between polymorphisms and fruit weight, locule number, and soluble solid content were detected. Several candidate genes and quantitative trait loci previously identified were validated and new associations detected. This study shows the advantages of using a collection of S. l. cerasiforme accessions to overcome the low resolution of association mapping in tomato.

Keywords: admixture; association mapping; linkage disequilibrium; tomato (Solanum lycopersicum).


Figures

Figure 1
Figure 1
Genetic and physical location of the polymorphic fragments sequenced on chromosome 2. Genetic distances on the EXPEN2000 reference map are indicated on the left of the chromosome. Physical contigs are drawn on the right of the scheme. Cloned QTL are indicated on the left of the chromosome. Gray shaded area indicates homology of contigs on chromosome 2 pseudo-molecule. Numbers of polymorphisms (SNPs and indels) found in noncoding and coding regions are indicated within bracket in the first and second position, respectively. Markers in italics show high LD when compared together.
Figure 2
Figure 2
Molecular diversity of the three groups of tomato based on 352 polymorphisms. Molecular diversity was estimated by Watterson's θ and compared with the total number of polymorphisms (S) for S. pimpinellifolium, S. l. cerasiforme, and S. l. esculentum.
Figure 3
Figure 3
Distribution of polymorphism MAFs among tomato species. S. l. cerasiforme (n = 63) is represented in black, S. l. esculentum (n = 17) in dark gray, and S. pimpinellifolium (n = 10) in light gray. Polymorphisms with overall species MAF lower than 0.05 were previously discarded (see Materials and Methods).
Figure 4
Figure 4
Estimates of LD (r2) vs. genetic and physical distance on chromosome 2 for the 63 S. l. cerasiforme accessions. Only polymorphic sites having MAF greater than 5% are indicated (see Materials and Methods). (A) Decay of r2 over genetic distance on chromosome 2. Plot of r2 over distance was fitted by nonlinear regression (red curve). (B) Decay of r2 over physical distance on the five major contigs. Plot of r2 over distance is fitted by nonlinear regression (red curve). The inset shows a more detailed view of the LD decay curve for markers located less than 20 Kb apart. (C) Matrix of pairwise LD P value between and within physical contigs. P values were calculated with 1000 permutations.
Figure 5
Figure 5
Cumulative density functions (CDF) using several alternative models of association. Model comparisons are performed for FW (A), LCN (B), and SSC (C). Associations are tested for all polymorphic sites with MAF >5% on 90 individuals. Naive GLM (black diamond) and K+Q models, with structure based on SSR markers (white squares), on 4 PCA axis (white circles) and on all STS markers (black squares) were tested. The diagonal indicates uniform distribution of P values under the expectation that random SNPs are unlinked to the polymorphisms controlling these traits (H0: no SNP effect).
Figure 6
Figure 6
Plot of association P values over the chromosome 2. Associations are estimated for 90 accessions. K+Q model was used to screen for association between polymorphisms and (A) FW, (B) LCN, and (C) SSC. Stars indicate the associations detected with the structure assessed with all STS, and black dots the associations detected with 20 SSR markers. The upper part of each graph represents associations along genetic distance over the entire chromosome 2. The lower part shows associations for each physical contig. Arrows indicate the marker name of the most significant associations. Adjusted P values for multiple testing (see Materials and Methods) are shown.

Similar articles

Cited by

References

    1. Ardlie K. G., Kruglyak L., Seielstad M., 2002. Patterns of linkage disequilibrium in the human genome. Nat. Rev. Genet. 3: 299–309 - PubMed
    1. Bai Y., Lindhout P., 2007. Domestication and breeding of tomatoes: what have we gained and what can we gain in the future? Ann. Bot. (Lond.) 100: 1085–1094 - PMC - PubMed
    1. Benjamini Y., Hochberg Y., 2000. On the adaptive control of the false discovery rate in multiple testing with independent statistics. J. Educ. Behav. Stat. 25: 60–83
    1. Bradbury P. J., Zhang Z., Kroon D. E., Casstevens T. M., Ramdoss Y., et al. , 2007. TASSEL: software for association mapping of complex traits in diverse samples. Bioinformatics 23: 2633–2635 - PubMed
    1. Buckler I., Edward S., Thornsberry J. M., 2002. Plant molecular diversity and applications to genomics. Curr. Opin. Plant Biol. 5: 107–111 - PubMed

Publication types

LinkOut - more resources