. 2012 Oct;160(2):708-25.
doi: 10.1104/pp.112.203679. Epub 2012 Aug 20.

Proteomic analysis of chloroplast-to-chromoplast transition in tomato reveals metabolic shifts coupled with disrupted thylakoid biogenesis machinery and elevated energy-production components

Affiliations

Proteomic analysis of chloroplast-to-chromoplast transition in tomato reveals metabolic shifts coupled with disrupted thylakoid biogenesis machinery and elevated energy-production components

Cristina Barsan et al. Plant Physiol. 2012 Oct.

Abstract

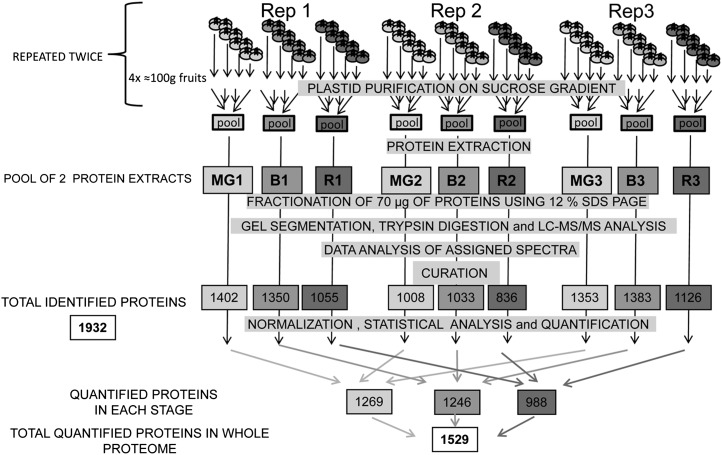
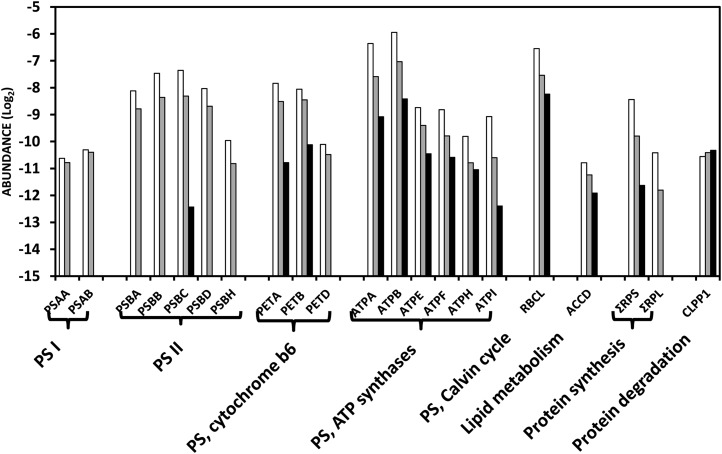
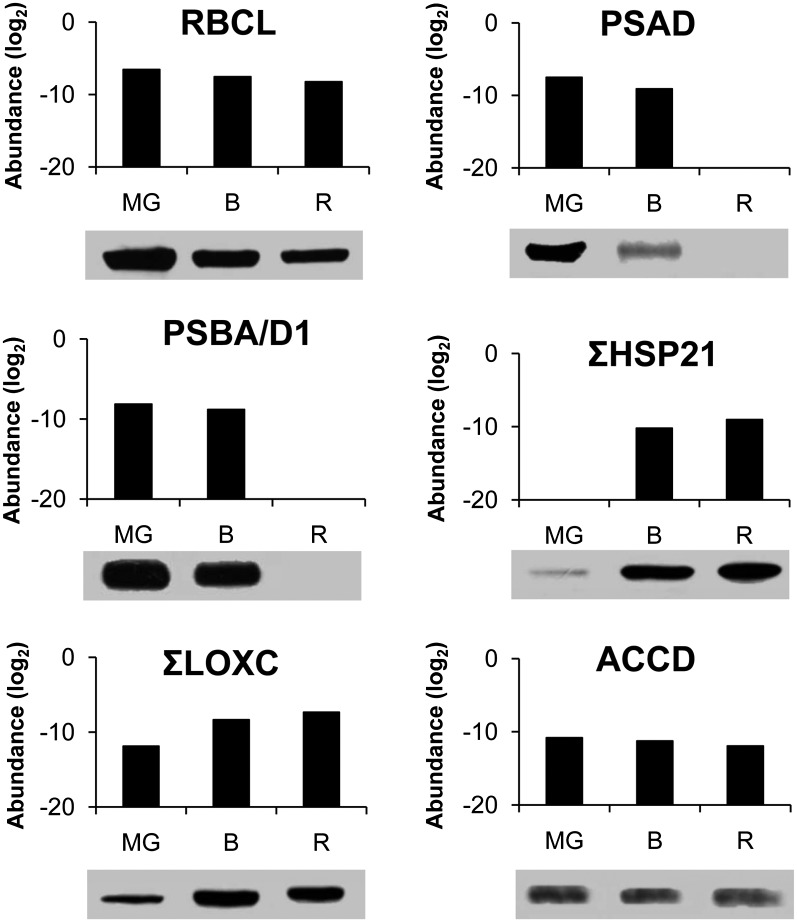
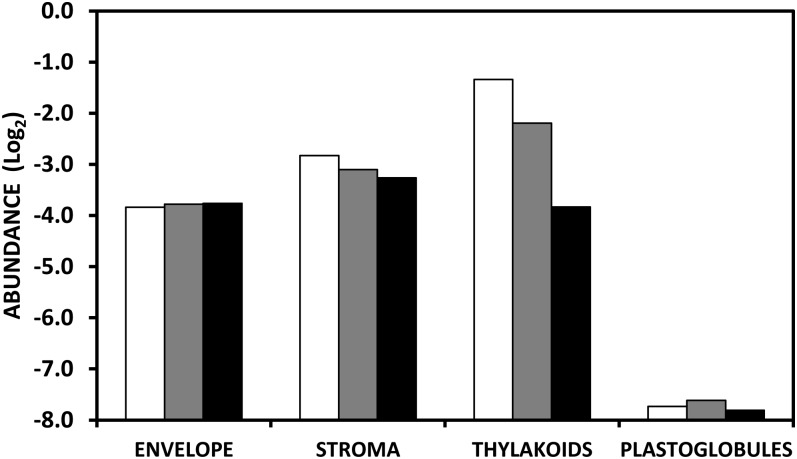
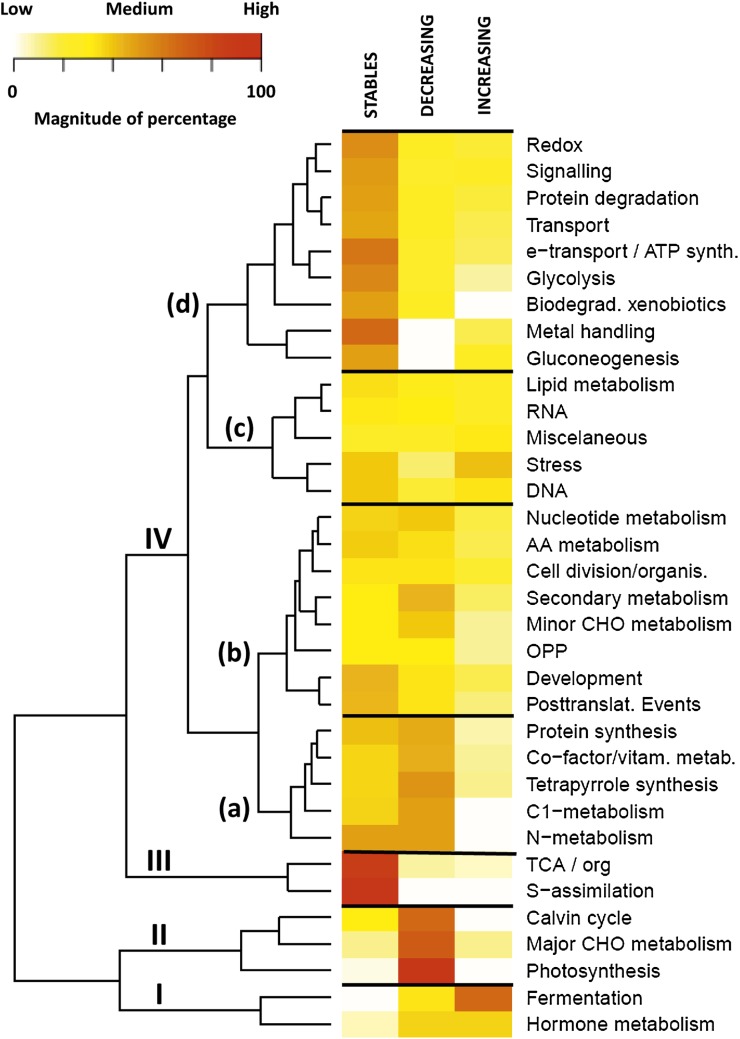
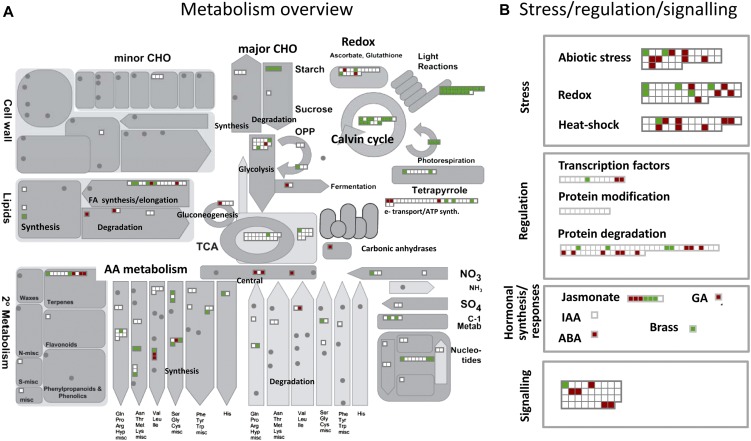
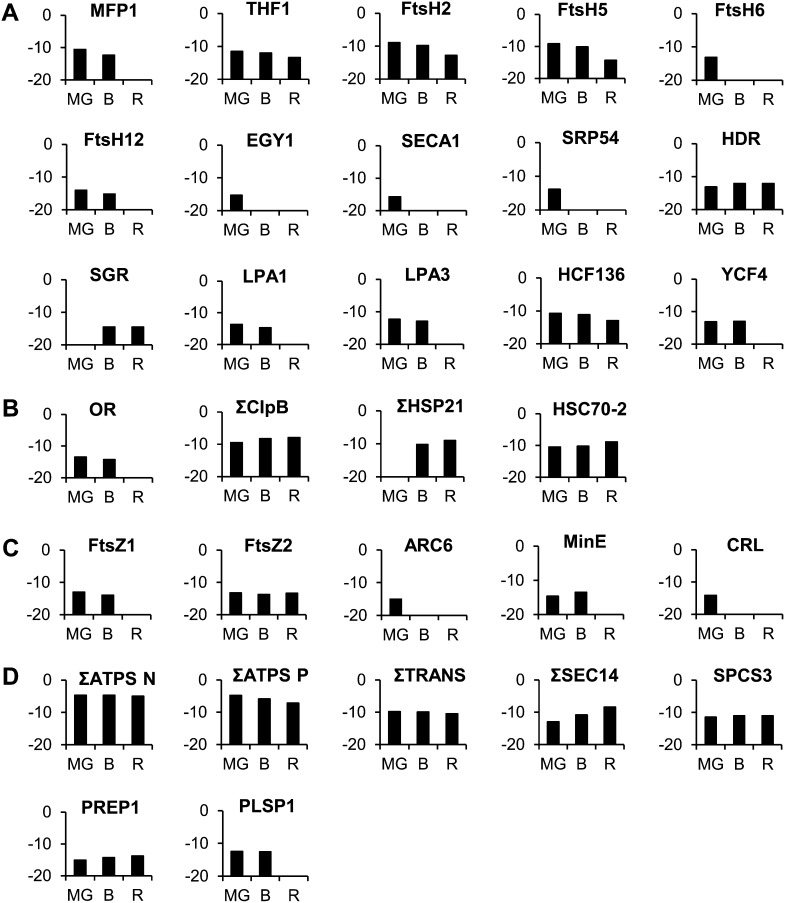
A comparative proteomic approach was performed to identify differentially expressed proteins in plastids at three stages of tomato (Solanum lycopersicum) fruit ripening (mature-green, breaker, red). Stringent curation and processing of the data from three independent replicates identified 1,932 proteins among which 1,529 were quantified by spectral counting. The quantification procedures have been subsequently validated by immunoblot analysis of six proteins representative of distinct metabolic or regulatory pathways. Among the main features of the chloroplast-to-chromoplast transition revealed by the study, chromoplastogenesis appears to be associated with major metabolic shifts: (1) strong decrease in abundance of proteins of light reactions (photosynthesis, Calvin cycle, photorespiration) and carbohydrate metabolism (starch synthesis/degradation), mostly between breaker and red stages and (2) increase in terpenoid biosynthesis (including carotenoids) and stress-response proteins (ascorbate-glutathione cycle, abiotic stress, redox, heat shock). These metabolic shifts are preceded by the accumulation of plastid-encoded acetyl Coenzyme A carboxylase D proteins accounting for the generation of a storage matrix that will accumulate carotenoids. Of particular note is the high abundance of proteins involved in providing energy and in metabolites import. Structural differentiation of the chromoplast is characterized by a sharp and continuous decrease of thylakoid proteins whereas envelope and stroma proteins remain remarkably stable. This is coincident with the disruption of the machinery for thylakoids and photosystem biogenesis (vesicular trafficking, provision of material for thylakoid biosynthesis, photosystems assembly) and the loss of the plastid division machinery. Altogether, the data provide new insights on the chromoplast differentiation process while enriching our knowledge of the plant plastid proteome.


Figures

Figure 1.
Figure 1.
Summarized experimental design used in this proteomic study. Plastids from four sets of four fruits were isolated separately in three independent replicates (Rep1, Rep2, and Rep3) for each developmental stage (MG 1–3; B 1–3; and R 1–3). This procedure was repeated twice and plastids corresponding to each stage were pooled for each experiment before protein extraction. The different steps from purification of plastids to curation of data are indicated and described in detail in “Material and Methods.” The number of proteins encountered in each individual analysis is given under the denomination of total resources, resulting in a nonredundant total list of 1,932 proteins that are reported in Supplemental Table S1. After normalization and statistical analysis, the number of proteins that could be quantified is indicated under the denomination of total quantified proteins. The list and quantitative information of the 1,529 quantified proteins is given in Supplemental Table S2.
Figure 2.
Figure 2.
Proteins of the tomato plastid proteome referenced in five plastid databases. A, Number and percentage of proteins (in black bars) referenced in each of the five databases, calculated on the basis of the 1,932 proteins listed in Supplemental Table S1. B, Percentage of the tomato plastid proteins not referenced (0) or referenced at least one, two, three, four, and five times in the different databases. The five databases are the following: AT-CHLORO, Plprot, PPDB, Uniprot, and SUBA.
Figure 3.
Figure 3.
Venn diagram of the number of proteins of the tomato plastid proteome predicted to be plastid localized by three predictors. A total of 1,492 proteins are predicted by at least one predictor, TargetP, Predotar, or iPSORT. The 47 plastid-encoded proteins are not concerned.
Figure 4.
Figure 4.
Scatter plots comparing log2 protein abundance between two differentiation stages of tomato fruit plastids. A, MG versus B. B, B versus R. C, MG versus R. Shades of gray represent proteins that are equally abundant in both stages; open squares correspond to proteins overexpressed at the MG stage; open circles are proteins overexpressed at the B stage, and open triangles represent proteins overabundant at the R stage. Data along the axis of the scatter plots indicate proteins that have been quantified at one of the two stages only and totally absent at the other stage. Numbers correspond to the number of proteins in each category. To draw the graphs, a log2 value of −17 was arbitrarily affected to proteins for which no abundance value was available in Supplemental Table S2.
Figure 5.
Figure 5.
Abundance of proteins encoded by the plastid genome. Proteins present at all three stages of plastid development (MG: white bars; B: gray bars; and R: black bars) were classified according the MapMan functional classes. Protein abundance is expressed as a log2. The graphs were generated using the data and symbols of Supplemental Table S2. PSA, PSB, PET, and ATP correspond to proteins of the subunits of PSI, PSII, cytochrome b6, and ATP synthase complexes, respectively. RBCL corresponds to the large subunit of Rubisco, ACCD to the D subunit of acetyl CoA carboxylase, and CLPP1 to the caseinolytic protease P1. ΣRPS and ΣRPL represent the sum of proteins of the small 30S and the large 50S subunits, respectively.
Figure 6.
Figure 6.
Comparison of protein abundance determined by proteomic analysis and immunoblotting. The abundance of proteins determined by proteomic analysis is expressed as log2. RBCL corresponds to the large subunit of Rubisco (GI89241679), PSAD to the D subunit of PSI (Solyc06g054260), PSBA/D1 to the A/D1 subunit of PSII (GI89241651), HSP21 to Heat Shock Proteins21 (Solyc03g082420 and Solyc05g014280), LOXC to lipoxygenase C (Solyc01g006540, Solyc01g006560, and Solyc12g011040), and ACCD to the D subunit of acetyl CoA carboxylase (GI89241680). For western blots, proteins were extracted from partially purified plastids as indicated in “Material and Methods.”
Figure 7.
Figure 7.
Abundance of proteins in the subplastidial compartments of tomato fruit plastids. Plastids were isolated from MG (white bars), B (gray bars), and R (black bars) fruit. Protein abundance is expressed as a log2. The present graph corresponds to Supplemental Table S3 generated by screening the tomato plastid proteome on the base of AT homologs with the AT-CHLORO subplastidial database (Ferro et al., 2010) for stroma, thylakoids, and envelope proteins and in Lundquist et al. (2012) for plastoglobule proteins.
Figure 8.
Figure 8.
Number and percentage of proteins in the MapMan functional classes for seven patterns of abundance. A, Stable. B, Decreasing early. C, Decreasing late. D, Decreasing continuously. E, Increasing early. F, Increasing late. G, Increasing continuously. The abundance patterns are described in Table II. Numbers in % represent the percentage of proteins within each functional class.
Figure 9.
Figure 9.
Heatmap showing the percentage of proteins of each functional class according to the abundance pattern. The three abundance patterns considered during the differentiation of chromoplasts are: stable, decreasing, and increasing. The magnitude of the percentage is represented by a color scale (top left) going from low (white), to medium (yellow), and high (red).
Figure 10.
Figure 10.
Metabolic overview comparing the protein abundance in MG and R tomato plastids. Red squares represent proteins with decreasing levels while blue squares correspond to proteins with increasing levels. A, Metabolic overview. B, Stress, regulation, and signaling proteins. MapMan software (Thimm et al., 2004; http://gabi.rzpd.de/projects/MapMan/).
Figure 11.
Figure 11.
Abundance of proteins (y axis in log2) involved in structural modifications of plastids, provision of energy, and translocation of precursors during the chloroplast-to-chromoplast transition. A, Proteins involved in the biogenesis of thylakoids and photosystems. B, Proteins involved in plastid differentiation. C, Proteins involved in plastid division. D, Proteins involved in energy and translocation. Protein abundance is expressed as a log2. The full name of the proteins is indicated in the text and in Supplemental Table S4. Abbreviations preceded by Σ correspond to the sum of several proteins harboring the same function. Individual values are given in Supplemental Table S4.

References

    1. Alba R, Fei Z, Payton P, Liu Y, Moore SL, Debbie P, Cohn J, D’Ascenzo M, Gordon JS, Rose JK, et al. (2004) ESTs, cDNA microarrays, and gene expression profiling: tools for dissecting plant physiology and development. Plant J 39: 697–714 - PubMed
    1. Aldridge C, Maple J, Møller SG. (2005) The molecular biology of plastid division in higher plants. J Exp Bot 56: 1061–1077 - PubMed
    1. Altschul SF, Gish W, Miller W, Myers EW, Lipman DJ. (1990) Basic local alignment search tool. J Mol Biol 215: 403–410 - PubMed
    1. Andersson MX, Dörmann P. (2009) Chloroplast membrane lipid biosynthesis and transport. In AS Sandelius, H Aronson, eds, The Chloroplast; Interactions with the Environment. Springer-Verlag, Berlin, pp 125–158
    1. Andon NL, Hollingworth S, Koller A, Greenland AJ, Yates JR, III, Haynes PA. (2002) Proteomic characterization of wheat amyloplasts using identification of proteins by tandem mass spectrometry. Proteomics 2: 1156–1168 - PubMed

Publication types

MeSH terms