. 2012 Oct 12;287(42):35658-35668.
doi: 10.1074/jbc.M112.398883. Epub 2012 Aug 20.

Glycosylation is dispensable for sorting of synaptotagmin 1 but is critical for targeting of SV2 and synaptophysin to recycling synaptic vesicles

Affiliations

Glycosylation is dispensable for sorting of synaptotagmin 1 but is critical for targeting of SV2 and synaptophysin to recycling synaptic vesicles

Sung E Kwon et al. J Biol Chem. .

Abstract

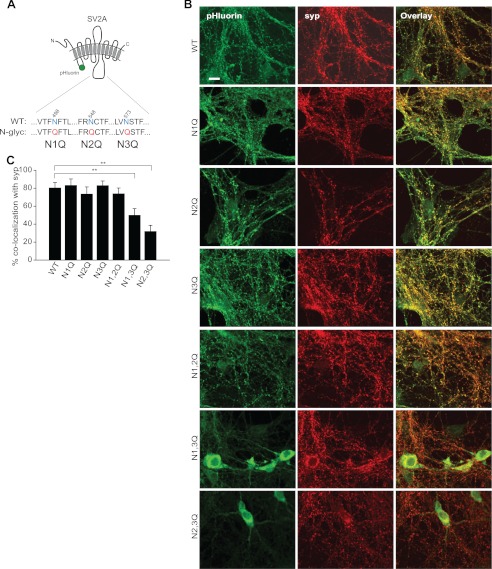
Glycosylation is a major form of post-translational modification of synaptic vesicle membrane proteins. For example, the three major synaptic vesicle glycoproteins, synaptotagmin 1, synaptophysin, and SV2, represent ∼30% of the total copy number of vesicle proteins. Previous studies suggested that glycosylation is required for the vesicular targeting of synaptotagmin 1, but the role of glycosylation of synaptophysin and SV2 has not been explored in detail. In this study, we analyzed all glycosylation sites on synaptotagmin 1, synaptophysin, and SV2A via mutagenesis and optical imaging of pHluorin-tagged proteins in cultured neurons from knock-out mice lacking each protein. Surprisingly, these experiments revealed that glycosylation is completely dispensable for the sorting of synaptotagmin 1 to SVs whereas the N-glycans on SV2A are only partially dispensable. In contrast, N-glycan addition is essential for the synaptic localization and function of synaptophysin. Thus, glycosylation plays distinct roles in the trafficking of each of the three major synaptic vesicle glycoproteins.


Figures

FIGURE 1.
FIGURE 1.
Loss of the N-glycan has differential effects on the localization of syt1-pH in WT versus syt1 KO neurons. A, schematic diagram shows the N-glycosylated Asn residue (N) in the luminal domain of WT syt1. N24Q denotes substitution of Asn with a Gln residue. B, Western blot shows expression levels of WT and N24Q mutant forms of syt1-pH. Samples were prepared from syt1 KO neurons infected with lentivirus. Anti-GFP antibody was used to detect the pHluorin. Syp served as a loading control. C, top, representative images from WT neurons in which syt1-pH was expressed by calcium phosphate-mediated transfection are shown. The first two panels show presynaptic boutons before and after stimulation at 20 Hz for 5 s. The next three panels show the same set of boutons during perfusion with low pH buffer followed by the NH4Cl solution. The surface fluorescence signals were quenched by applying low pH solution. Internal acidic fluorescence signals were subsequently dequenched by NH4Cl perfusion. The surface fraction of syt1-pH was determined as detailed in the legend to Fig. 3, F and G. Bottom, same experiment described in the top panel was repeated using N24Q syt1-pH. Scale bar, 2 μm. D, left, average normalized fluorescence traces for WT (closed circles) and N24Q mutant forms (open circles) of syt1-pH in response to the 20-Hz, 5-s stimulus train are shown. Average is from four coverslips, 25 boutons each. Each coverslip represents an independent neuronal culture. Middle, surface fraction of syt1-pH was plotted against the evoked fluorescence change for individual presynaptic boutons in transfected WT neurons. Each circle represents a bouton expressing WT (closed circles, 40 boutons from two coverslips) or N24Q (open circles, 34 boutons from two coverslips) syt1-pH. The two groups show clear segregation. Right, comparison of mean surface fraction between WT and N24Q mutant forms of syt1-pH expressed in WT neurons is shown. Average is from four coverslips, 25 boutons each. E, same experiments described above in C and D were repeated in syt1 KO neurons. Left, average normalized fluorescence traces for WT (closed circles) and N24Q mutant forms (open circles) of syt1-pH in response to the 20-Hz, 5-s stimulus train are shown. Average is from four coverslips, 25 boutons each. Middle, surface fraction of syt1-pH was plotted against the evoked fluorescence change for individual boutons in syt1 KO neurons expressing WT (closed circles, 33 boutons from two coverslips) or N24Q (open circles, 33 boutons from two coverslips) syt1-pH. No segregation was observed between the two groups. Right, comparison of mean surface fraction between WT and N24Q mutant syt1-pH expressed in KO neurons is shown. Average is from four coverslips, 25 boutons each. To assess significance, Student's t test was used throughout this study. **, p < 0.01. Error bars, S.E.
FIGURE 2.
FIGURE 2.
Loss of the O-glycan has differential effects on the localization of syt1-pH in WT versus syt1 KO neurons. A, schematic diagram shows O-glycosylated Thr residues in WT syt1. T15,16A denotes substitution of Thr-15 and Thr-16 with Ala residues. B, expression levels of WT and the T15,16A mutant syt1-pH were compared by determining total pHluorin fluorescence per bouton in arbitrary units by NH4Cl superfusion (as shown in the legend of Fig. 1C) of syt1 KO neurons transfected with these constructs. C, left, average normalized fluorescence traces for WT (closed circles) and T15,16A mutant forms (open circles) of syt1-pH, which were expressed in WT neurons by calcium phosphate-mediated transfection, in response to the 20-Hz, 5-s stimulus train are shown. Average is from four coverslips, 25 boutons each. Middle, surface fraction of syt1-pH was plotted against the evoked fluorescence change for individual presynaptic boutons in transfected WT neurons. Each circle represents a bouton expressing WT (closed circles, 40 boutons from two coverslips) or T15,16A (open circles, 32 boutons from two coverslips) syt1-pH. The two groups show clear segregation. Right, comparison of mean surface fraction between WT and T15,16A mutant syt1-pH is shown. Average is from four coverslips, 25 boutons each. D, same experiment described in C was repeated in syt1 KO neurons. Left, average normalized fluorescence traces for WT (closed circles) and T15,16A mutant forms (open circles) of syt1-pH in response to the 20-Hz, 5-s stimulus train are shown. Average is from four coverslips, 20 boutons each. Middle, surface fraction of syt1-pH was plotted against the evoked fluorescence change for individual boutons in syt1 KO neurons expressing WT (closed circles, 33 boutons from two coverslips) or T15,16A (open circles, 32 boutons from two coverslips) mutant syt1-pH. No segregation was observed between the two groups. Right, comparison of mean surface fraction between WT and the T15,16A mutant syt1-pH is shown. **, p < 0.01. Error bars, S.E.
FIGURE 3.
FIGURE 3.
Syt1 lacking all glycans is normally sorted to recycling SVs where it rescues normal rates of endocytosis. A, schematic diagram shows glycosylated residues (blue) in WT syt1 that were disrupted via point mutations (red). B, immunocytochemistry of WT syt1-pH and mutant syt1-pH lacking all glycans (T15,16A/N24Q) expressed in syt1 KO neurons using lentivirus is shown. Left, an anti-GFP antibody was used to visualize syt1-pH. Middle, synapses were labeled using an anti-synaptophysin antibody (syp). Right, merged image is shown. Scale bar, 4 μm. C, quantification of results in B is shown. 68.7 ± 6.5% and 63.4 ± 6.0% of syp fluorescence co-localized with WT and T15,16A/N24Q mutant forms of syt1-pH, respectively. D, sample images from neurons expressing syt1-pH. Top, first two panels show boutons expressing WT Syt1-pH at rest and during a 10-Hz, 30-s stimulus train. The next three panels show the same boutons at rest, during perfusion with low pH buffer and during perfusion with the NH4Cl buffer. Bottom, same experiments as described in the top panel were repeated using T15,16A/N24Q syt1-pH. Scale bar, 4 μm. E, average normalized fluorescence traces for WT (closed circles) and T15,16A/N24Q mutant forms (open circles) of syt1-pH in response to the 10-Hz, 30-s stimulus train are shown. Average is from four coverslips, 25 boutons each. F, average traces from the WT and mutant syt1 pHluorins are shown. The surface fluorescence signals were quenched by applying low pH solution (F1). Internal acidic fluorescence signals were subsequently dequenched by NH4Cl superfusion (F2). Average is from four coverslips, 25 boutons each. G, recycling pool size was estimated by normalizing the magnitude of the evoked fluorescence change, 25 s after the beginning of the stimulus train (10 Hz, 30 s), to the size of the total acidified SV pool (F2 as shown above). No significant difference was observed between WT and T15,16A/N24Q syt1-pHs. H, surface fraction of syt1-pH, which was estimated by F1/(F1+F2), was not significantly different between WT and T15,16A/N24Q syt1-pHs. I, SV cycling was assayed using sypHy in syt1 KO neurons expressing untagged WT or T15,16A/N24Q mutant syt1. The mutant form of syt1 rescued normal rates of endocytosis. Average is from three coverslips, 30 boutons each. J, average post-stimulus endocytic time constants from the experiments shown in H are displayed. **, p < 0.01. Error bars, S.E.
FIGURE 4.
FIGURE 4.
N-Glycans on SV2A are partially dispensable for synaptic localization. A, schematic diagram shows N-glycosylated residues (blue) in WT SV2A that were disrupted via point mutations (red). B, immunocytochemistry of WT and mutant forms of SV2A-pH expressed in SV2A double KO neurons is shown. An anti-GFP antibody was used to visualize SV2A-pH. Synapses were identified by staining with an anti-synaptophysin antibody. Of all proteins tested, only the N1Q/N3Q and the N2Q/N3Q double mutants accumulated in the cell body of neurons. Scale bar, 10 μm. C, quantification of the results in B is shown. The degree of co-localization of syp with each of the WT and mutant forms of SV2A-pH was as follows (in %): 80.3 ± 6.1 (WT), 83.1 ± 7.3 (N1Q), 73.4 ± 8.1 (N2Q), 82.9 ± 5.2 (N3Q), 73.8 ± 6.5 (N1Q/N2Q), 49.8 ± 7.5 (N1Q/N3Q), and 31.8 ± 6.9 (N2Q/N3Q). **, p < 0.01. Error bars, S.E.
FIGURE 5.
FIGURE 5.
Glycosylation regulates the trafficking and vesicular targeting of SV2A. A, representative traces of WT and glycosylation mutant forms of SV2A-pH (left) show fluorescence changes in response to the 10-Hz, 30-s stimulus train and (right) the steady-state fluorescence distribution during perfusion with low pH (5.5) and NH4Cl buffers. B, normalized average traces of fluorescence change, evoked by stimulus train (10 Hz, 30 s), from WT (closed circles) and N1/2Q mutant (open circles) forms of SV2A-pH are shown. Average is from three coverslips, 30 boutons each. C, comparison of endocytic time constants between WT and the mutant forms of SV2A-pH is shown. Average is from three coverslips, 30 boutons each. Error bars, S.E.
FIGURE 6.
FIGURE 6.
Glycosylation affects the synaptic localization of syp. A, schematic diagram shows the lone glycosylation site (blue) of syp; the N53Q point mutation is indicated in red. B, images from syp KO neurons, expressing WT or the N-glycosylation mutant form of sypHy are shown. An anti-GFP antibody was used to visualize sypHy; synapses were identified by staining with an anti-SV2A antibody. Whereas WT sypHy was localized to synapses, the N53Q mutant accumulated in the cell body. Scale bar, 15 μm. C, quantification of results in B is shown. 74.9 ± 4.9% and 26.2 ± 5.5% of SV2A fluorescence co-localized with WT and N53Q mutant forms of sypHy, are shown, respectively. D, syp KO neurons expressing WT or N53Q sypHy were depolarized using a 10-Hz, 30-s stimulus train. WT sypHy exhibited stimulus-induced changes in fluorescence whereas the N53Q mutant did not respond. Shown are representative examples (three coverslips, 30 boutons each). Scale bar, 5 μm. E, top, normalized average traces of fluorescence change, evoked by stimulus train (10 Hz, 30 s), from WT sypHy are shown. Bottom, N53Q mutant forms of sypHy show no fluorescence changes in response to the 10-Hz, 30-s stimulus train. F, Western blot shows expression levels of the WT and N53Q mutant forms of sypHy. Samples were prepared from syp KO neurons infected with lentivirus. Syntaxin served as a loading control. **, p < 0.01. Error bars, S.E.

Similar articles

Cited by

References

    1. Bonanomi D., Benfenati F., Valtorta F. (2006) Protein sorting in the synaptic vesicle life cycle. Prog. Neurobiol. 80, 177–217 - PubMed
    1. Hannah M. J., Schmidt A. A., Huttner W. B. (1999) Synaptic vesicle biogenesis. Annu. Rev. Cell Dev. Biol. 15, 733–798 - PubMed
    1. Sampo B., Kaech S., Kunz S., Banker G. (2003) Two distinct mechanisms target membrane proteins to the axonal surface. Neuron 37, 611–624 - PubMed
    1. Kittler J. T., Moss S. J. (2003) Modulation of GABAA receptor activity by phosphorylation and receptor trafficking: implications for the efficacy of synaptic inhibition. Curr. Opin. Neurobiol. 13, 341–347 - PubMed
    1. Haas K. F., Broadie K. (2008) Roles of ubiquitination at the synapse. Biochim. Biophys. Acta 1779, 495–506 - PMC - PubMed

Publication types

LinkOut - more resources