

Bayesian probabilistic population projections for all countries
- PMID: 22908249
- PMCID: PMC3435191
- DOI: 10.1073/pnas.1211452109
Bayesian probabilistic population projections for all countries
Abstract
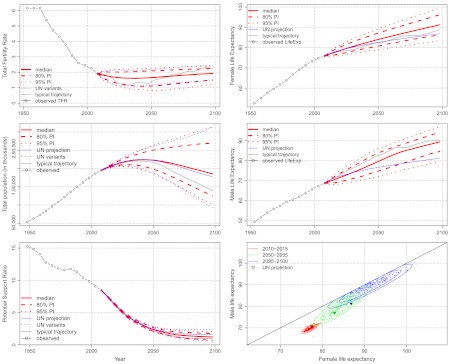
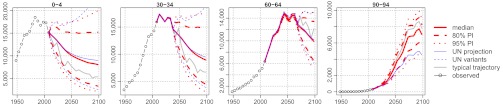
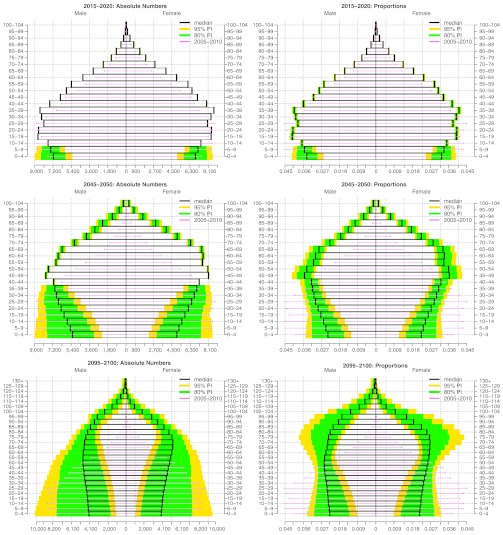
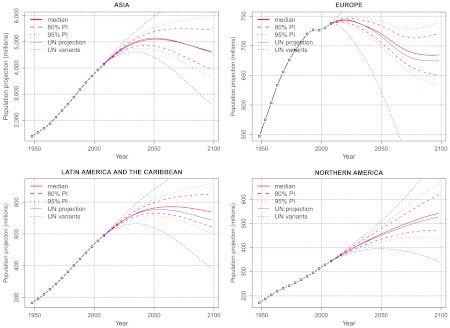
Projections of countries' future populations, broken down by age and sex, are widely used for planning and research. They are mostly done deterministically, but there is a widespread need for probabilistic projections. We propose a bayesian method for probabilistic population projections for all countries. The total fertility rate and female and male life expectancies at birth are projected probabilistically using bayesian hierarchical models estimated via Markov chain Monte Carlo using United Nations population data for all countries. These are then converted to age-specific rates and combined with a cohort component projection model. This yields probabilistic projections of any population quantity of interest. The method is illustrated for five countries of different demographic stages, continents and sizes. The method is validated by an out of sample experiment in which data from 1950-1990 are used for estimation, and applied to predict 1990-2010. The method appears reasonably accurate and well calibrated for this period. The results suggest that the current United Nations high and low variants greatly underestimate uncertainty about the number of oldest old from about 2050 and that they underestimate uncertainty for high fertility countries and overstate uncertainty for countries that have completed the demographic transition and whose fertility has started to recover towards replacement level, mostly in Europe. The results also indicate that the potential support ratio (persons aged 20-64 per person aged 65+) will almost certainly decline dramatically in most countries over the coming decades.
Conflict of interest statement
The authors declare no conflict of interest.
Figures
References
-
- Whelpton PK. Population of the United States, 1925–1975. Am J Sociol. 1928;31:253–270.
-
- Whelpton PK. An empirical method for calculating future population. J Am Stat Assoc. 1936;31:457–473.
-
- Leslie PH. On the use of matrices in certain population dynamics. Biometrika. 1945;33:183–212. - PubMed
-
- Preston SH, Heuveline P, Guillot M. Demography: Measuring and Modeling Population Processes. Malden, MA: Blackwell; 2001.
-
- United Nations. World Population Prospects: The 2010 Revision. New York: United Nations; 2011.
Publication types
MeSH terms
Grants and funding
LinkOut - more resources
Full Text Sources
