Comparative Study
. 2012 Sep 4;109(36):14348-52.
doi: 10.1073/pnas.1207806109. Epub 2012 Aug 20.

Impact of abrupt deglacial climate change on tropical Atlantic subsurface temperatures

Affiliations
Comparative Study

Impact of abrupt deglacial climate change on tropical Atlantic subsurface temperatures

Matthew W Schmidt et al. Proc Natl Acad Sci U S A. .

Erratum in

  • Proc Natl Acad Sci U S A. 2012 Nov 13;109(46):19034. J, Link [corrected to Ji, Link]

Abstract

Both instrumental data analyses and coupled ocean-atmosphere models indicate that Atlantic meridional overturning circulation (AMOC) variability is tightly linked to abrupt tropical North Atlantic (TNA) climate change through both atmospheric and oceanic processes. Although a slowdown of AMOC results in an atmospheric-induced surface cooling in the entire TNA, the subsurface experiences an even larger warming because of rapid reorganizations of ocean circulation patterns at intermediate water depths. Here, we reconstruct high-resolution temperature records using oxygen isotope values and Mg/Ca ratios in both surface- and subthermocline-dwelling planktonic foraminifera from a sediment core located in the TNA over the last 22 ky. Our results show significant changes in the vertical thermal gradient of the upper water column, with the warmest subsurface temperatures of the last deglacial transition corresponding to the onset of the Younger Dryas. Furthermore, we present new analyses of a climate model simulation forced with freshwater discharge into the North Atlantic under Last Glacial Maximum forcings and boundary conditions that reveal a maximum subsurface warming in the vicinity of the core site and a vertical thermal gradient change at the onset of AMOC weakening, consistent with the reconstructed record. Together, our proxy reconstructions and modeling results provide convincing evidence for a subsurface oceanic teleconnection linking high-latitude North Atlantic climate to the tropical Atlantic during periods of reduced AMOC across the last deglacial transition.


Conflict of interest statement

The authors declare no conflict of interest.

Figures

Fig. 1.
Fig. 1.
Site location and modern surface and subsurface hydrography. Temperature (color) and salinity (contour) along density surface σ = 1,026.8 that varies from approximately 200 m near the equator to approximately 600 m in the subtropics. The sharp subsurface temperature gradient along the boundary between the subtropical and tropical gyres is evident, separating the warm SMW in the subtropical North Atlantic from the fresher tropical gyre water. This maximum subsurface temperature gradient forms at approximately 300 m, extending to the western boundary and intersecting with it near 10 °N. The two solid arrows indicate the southwestward subducted flow in the TNA and the northward AMOC return flow, respectively. The dashed arrow indicates the equatorward western boundary flow resulting from bifurcation of the subducted flow at the western boundary. Competition between this equatorward flow and the northward AMOC return flow is a key element of the subsurface oceanic gateway mechanism. (Inset) Shows the annual mean temperature at 30 m depth in the southern Caribbean and the location of VM12-107 (11.33 °N, 66.63 °W; 1,079 m), just outside the Cariaco Basin. Also shown are the locations of the Cariaco Basin and Laguna de Los Anteojos in northern Venezuela. The cooler temperatures near site VM12-107 are caused by coastal upwelling and are reflected in the calculated core-top Mg/Ca temperatures from this site. The temperature and salinity data are based on World Ocean Atlas 2009 (24, 38).
Fig. 2.
Fig. 2.
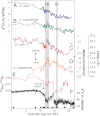
Oxygen isotope and Mg/Ca records from site VM12-107 over the past 22 ky. Deglacial δ18O and Mg/Ca ratio records in G. ruber (upper mixed layer) (A, C) and G. crassaformis (lower thermocline) (B, D) from southern Caribbean core VM12-107. The following equations were used to convert Mg/Ca ratios to temperature: for G. ruber, Mg/Ca = 0.38 exp[0.09 ∗ Temp.] (21), and for G. crassaformis Mg/Ca = 0.339 exp[0.09 ∗ Temp.] (21). Note the abrupt subsurface warming events during the YD and H1 in the G. crassaformis (orange line) temperature record. Analytical error on replicate Mg/Ca measurements on G. ruber and G. crassaformis are also shown (C, D). (E) Bermuda Rise 231Pa/230Th record (27) indicating changes in AMOC strength across the deglacial. (F) Greenland NGRIP ice core δ18O record (26). Gray bars indicate the YD and H1. Black triangles on x axis show calibrated 14C-based ages in VM12-107.
Fig. 3.
Fig. 3.
Tropical Atlantic climate evolution across the YD. (A) The G. ruber Mg/Ca–temperature record from sediment core VM12-107. Note the early YD warming, followed by an abrupt cooling at 12.4 ky. (B) The G. ruber Mg/Ca–temperature record from the Cariaco Basin (10) showing an abrupt cooling at the onset of the YD. Note the coolest temperatures in the Cariaco Basin correspond to the warmest temperatures at our study site. (C) Mg/Ca ratios in G. crassaformis from VM12-107 indicating an abrupt subsurface warming in the Bonaire Basin at the start of the YD. (D) The ice volume-corrected Tobago Basin benthic foraminiferal δ18O record (14), using an updated age model based on CALIB 6.0 (16), indicating a gradual warming at 1.3 km water depth across the YD. (E) The G. ruber Mg/Ca–SST record from the western equatorial Atlantic (36) indicating significant warming during the early YD. (F) An eastern equatorial Atlantic SST record (28) based on Mg/Ca ratios in G. ruber. (G) Bermuda Rise 231Pa/230Th record (27) indicating changes in AMOC strength across the deglacial. (H) The percentage of clastic sediments in a Venezuelan Andes lake core record indicating the development of extremely arid conditions during the early YD and a gradual return to wetter conditions during the late YD (29). (I) The Greenland NGRIP ice core δ18O record, indicating the abrupt return to cold temperatures in Greenland during the YD (26). The gray and green bars indicate the early and late YD, respectively.
Fig. 4.
Fig. 4.
Water-hosing simulation results under LGM forcings and boundary conditions. Changes in (A) surface (averaged between 5 and 35 m), and (B) subsurface (averaged between 300 and 600 m) temperatures between a LGM water-hosing and control simulation. The temperature change was computed as the difference between: (i) the average temperature of the last 20 y of the 100-y hosing run where a freshwater forcing of 0.1 Sv was held constant, and (ii) the average temperature of the same period of the control simulation. Time evolution of the subsurface temperature change averaged over the maximum subsurface temperature gradient zone indicated by the rectangle (Lower) is shown in Fig. S7. (A) Also shows the site locations (corresponding to encircled numbers) for: (i) VM12-107 in the Bonaire Basin, (ii) the Tobago Basin core M35003-4 (14), (iii) the western equatorial Atlantic core GeoB3129-3911 (28), and (iv) the eastern equatorial Atlantic core MD03-2707 (36).

References

    1. Zhang R. Anticorrelated multidecadal variations between surface and subsurface tropical North Atlantic. Geophys Res Lett. 2007;34:1–6.
    1. Zhang R, Delworth TL, Held IM. Can the Atlantic Ocean drive the observed multidecadal variability in Northern Hemisphere mean temperature? Geophys Res Lett. 2007;34:1–6.
    1. Chang P, et al. Oceanic link between abrupt changes in the North Atlantic Ocean and the African monsoon. Nat Geosci. 2008;1:444–448.
    1. Otto-Bliesner BL, Brady EC. The sensitivity of the climate response to the magnitude and location of freshwater forcing: Last glacial maximum experiments. Quat Sci Rev. 2010;29:56–73.
    1. Wen CH, Chang P, Saravanan R. Effect of Atlantic meridional overturning circulation changes on tropical Atlantic sea surface temperature variability: A 2 1/2-layer reduced-gravity ocean model study. J Clim. 2010;23:312–332.

Publication types