

Warming-induced shift in European mushroom fruiting phenology
- PMID: 22908273
- PMCID: PMC3437857
- DOI: 10.1073/pnas.1200789109
Warming-induced shift in European mushroom fruiting phenology
Abstract
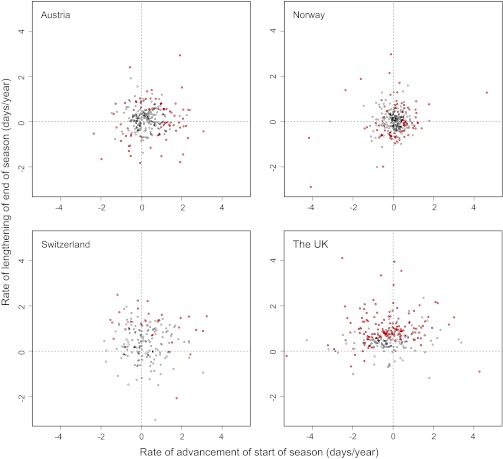
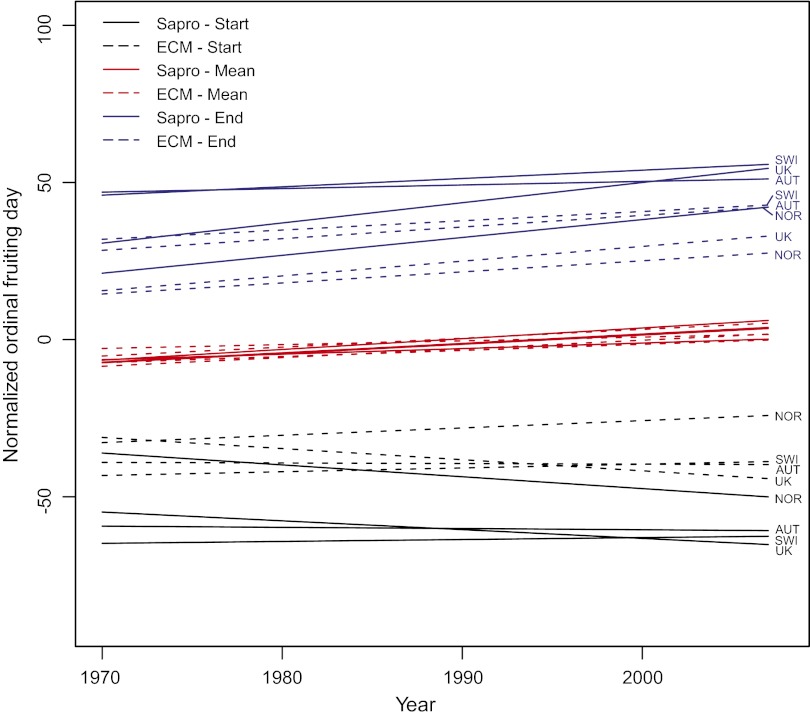
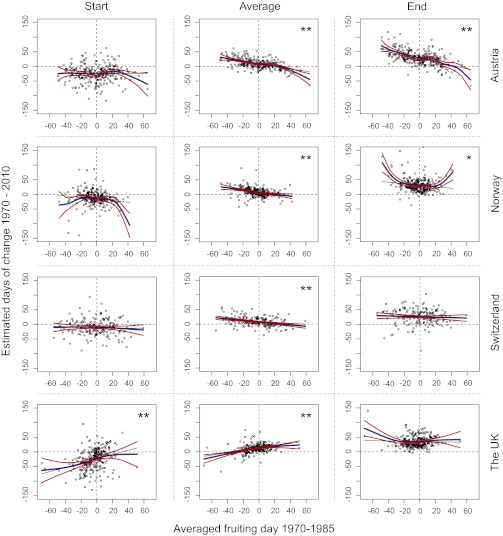
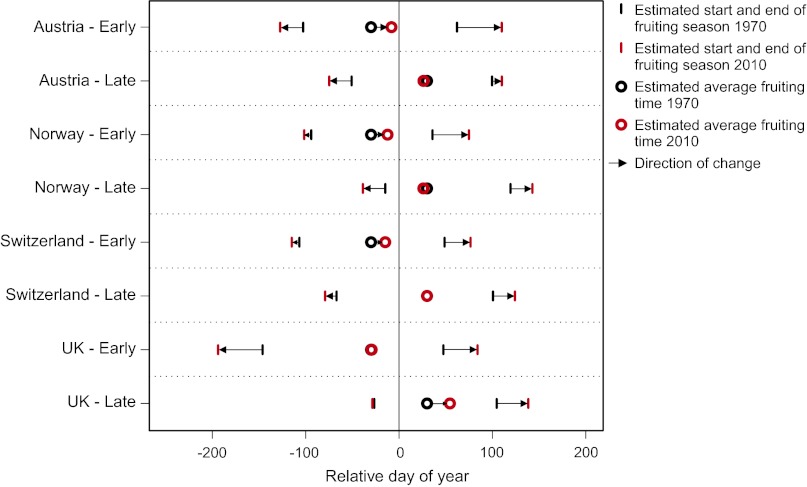
In terrestrial ecosystems, fungi are the major agents of decomposition processes and nutrient cycling and of plant nutrient uptake. Hence, they have a vital impact on ecosystem processes and the terrestrial carbon cycle. Changes in productivity and phenology of fungal fruit bodies can give clues to changes in fungal activity, but understanding these changes in relation to a changing climate is a pending challenge among ecologists. Here we report on phenological changes in fungal fruiting in Europe over the past four decades. Analyses of 746,297 dated and geo-referenced mushroom records of 486 autumnal fruiting species from Austria, Norway, Switzerland, and the United Kingdom revealed a widening of the annual fruiting season in all countries during the period 1970-2007. The mean annual day of fruiting has become later in all countries. However, the interspecific variation in phenological responses was high. Most species moved toward a later ending of their annual fruiting period, a trend that was particularly strong in the United Kingdom, which may reflect regional variation in climate change and its effects. Fruiting of both saprotrophic and mycorrhizal fungi now continues later in the year, but mycorrhizal fungi generally have a more compressed season than saprotrophs. This difference is probably due to the fruiting of mycorrhizal fungi partly depending on cues from the host plant. Extension of the European fungal fruiting season parallels an extended vegetation season in Europe. Changes in fruiting phenology imply changes in mycelia activity, with implications for ecosystem function.
Conflict of interest statement
The authors declare no conflict of interest.
Figures
Comment in
-
Mushroom phenological changes: a role for resource availability?Proc Natl Acad Sci U S A. 2013 Jan 29;110(5):E333-4. doi: 10.1073/pnas.1219640110. Epub 2013 Jan 23. Proc Natl Acad Sci U S A. 2013. PMID: 23345453 Free PMC article. No abstract available.
-
Reply to Gange et al.: Climate-driven changes in the fungal fruiting season in the United Kingdom.Proc Natl Acad Sci U S A. 2013 Jan 29;110(5):E335. doi: 10.1073/pnas.1221131110. Proc Natl Acad Sci U S A. 2013. PMID: 23479781 Free PMC article. No abstract available.
References
-
- Read DJ, Perez-Moreno J. Mycorrhizas and nutrient cycling in ecosystems – a journey towards. New Phytol. 2003;157:475–492. - PubMed
-
- Smith SE, Read DJ. In: Mycorrhizal Symbiosis. Smith SE, Read DJ, editors. London: Academic; 2008.
-
- Orwin KH, Kirschbaum MUF, St John MG, Dickie IA. Organic nutrient uptake by mycorrhizal fungi enhances ecosystem carbon storage: A model-based assessment. Ecol Lett. 2011;14:493–502. - PubMed
-
- van der Heijden MG, Bardgett RD, van Straalen NM. The unseen majority: Soil microbes as drivers of plant diversity and productivity in terrestrial ecosystems. Ecol Lett. 2008;11:296–310. - PubMed
-
- Büntgen U, Kauserud H, Egli S. Linking climate variability to mushroom productivity and phenology. Front Ecol Environ. 2011;10:14–19.
Publication types
MeSH terms
Grants and funding
LinkOut - more resources
Full Text Sources
Molecular Biology Databases
Miscellaneous
