. 2012 Aug 20;198(4):545-60.
doi: 10.1083/jcb.201111091.

Rab10 and myosin-Va mediate insulin-stimulated GLUT4 storage vesicle translocation in adipocytes

Affiliations

Rab10 and myosin-Va mediate insulin-stimulated GLUT4 storage vesicle translocation in adipocytes

Yu Chen et al. J Cell Biol. .

Abstract

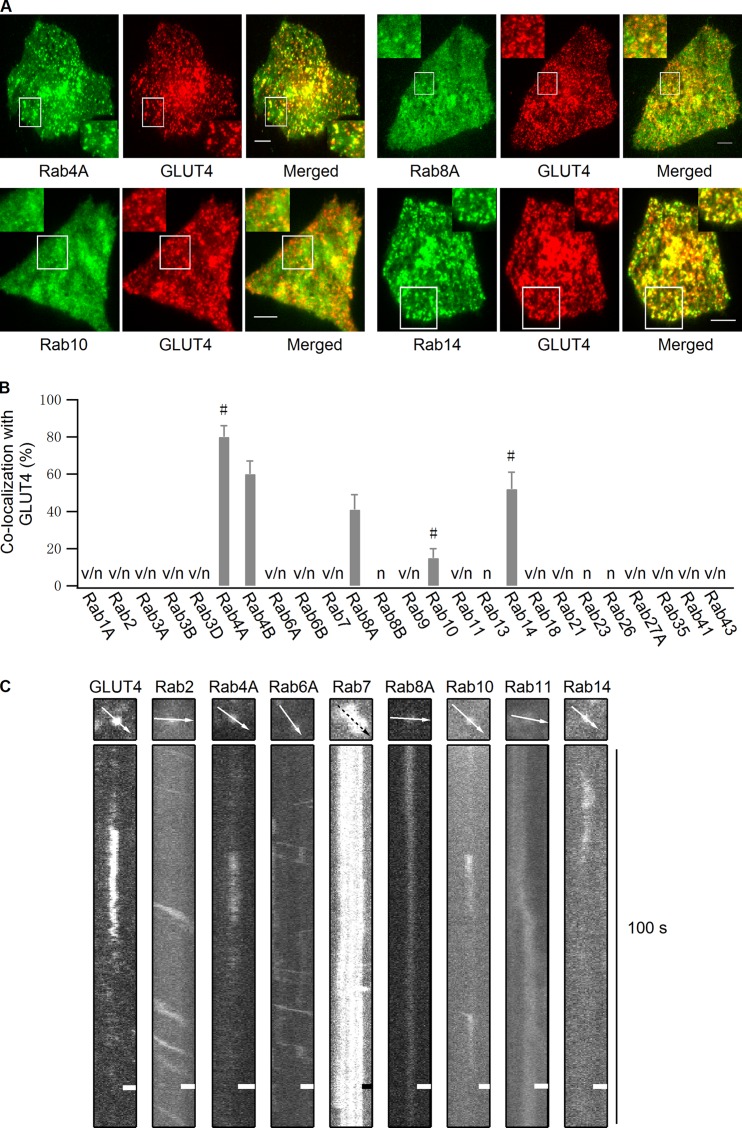
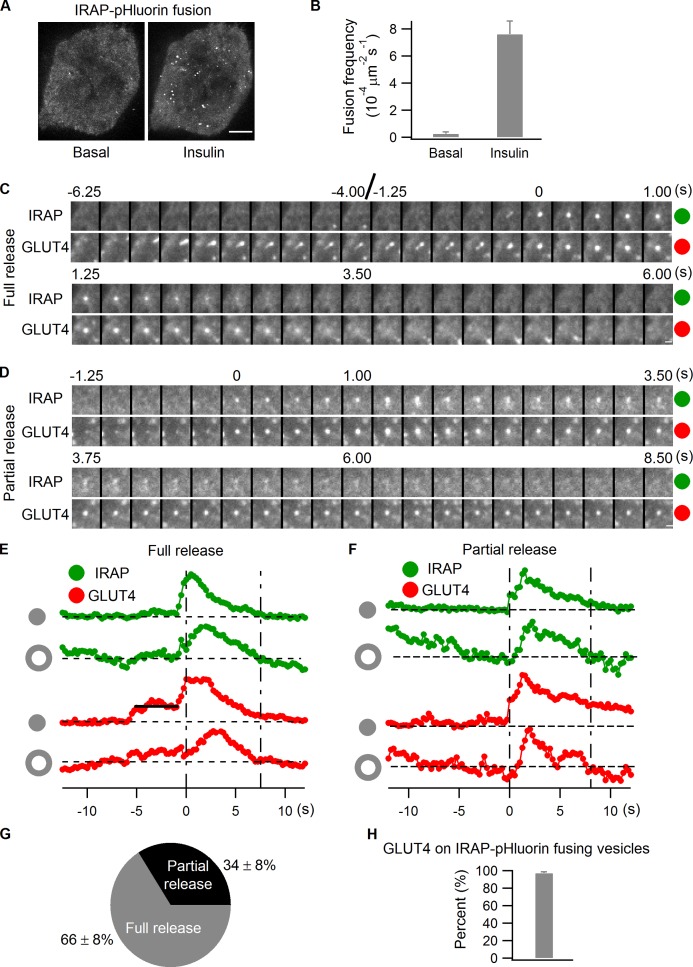
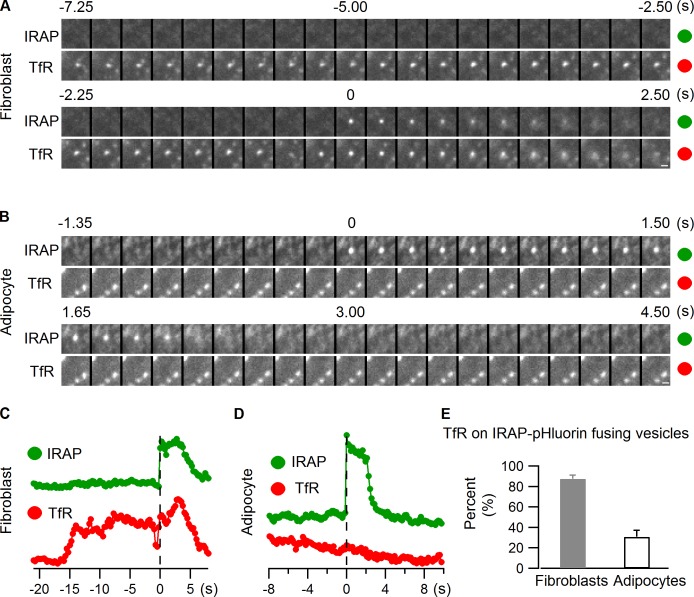
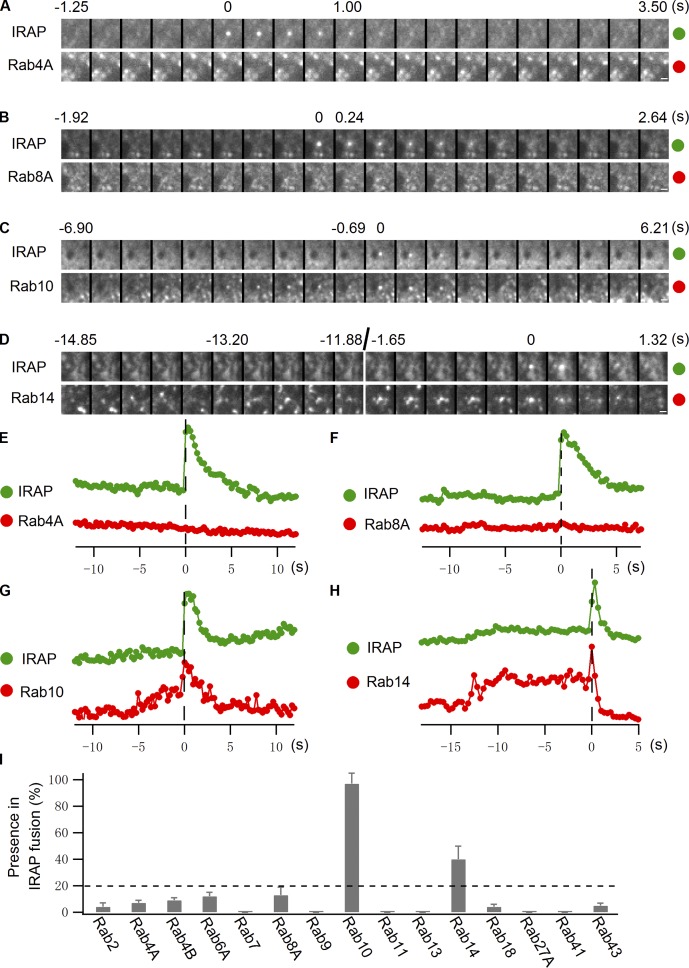
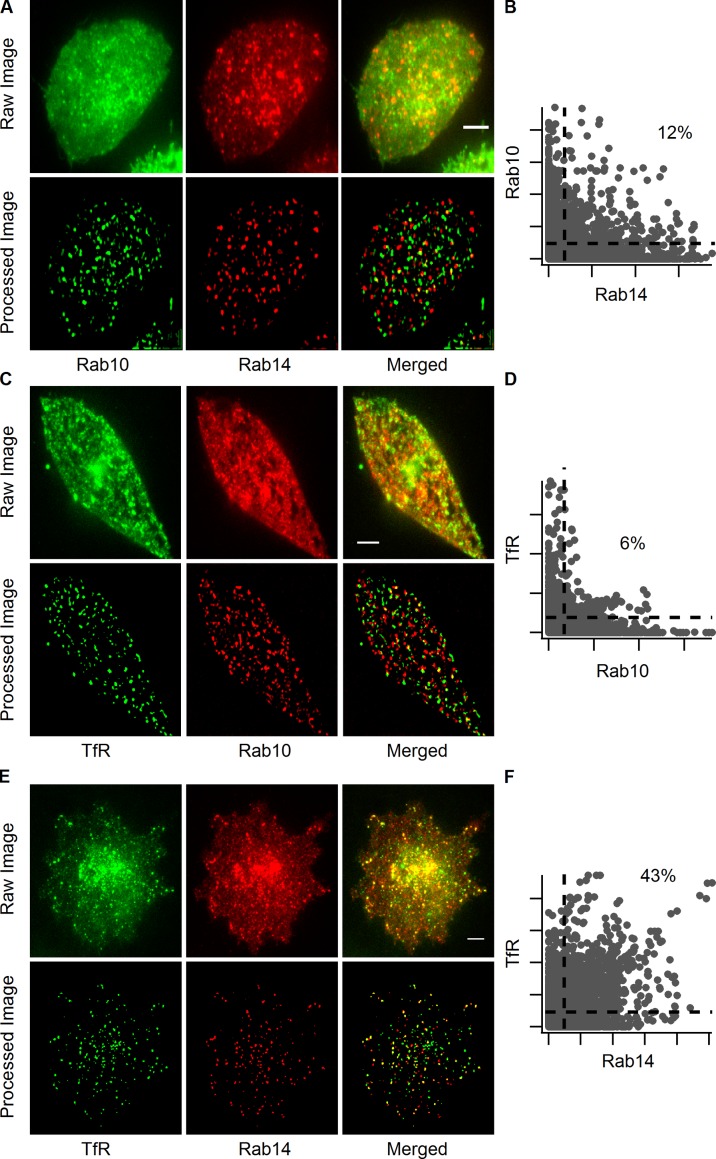
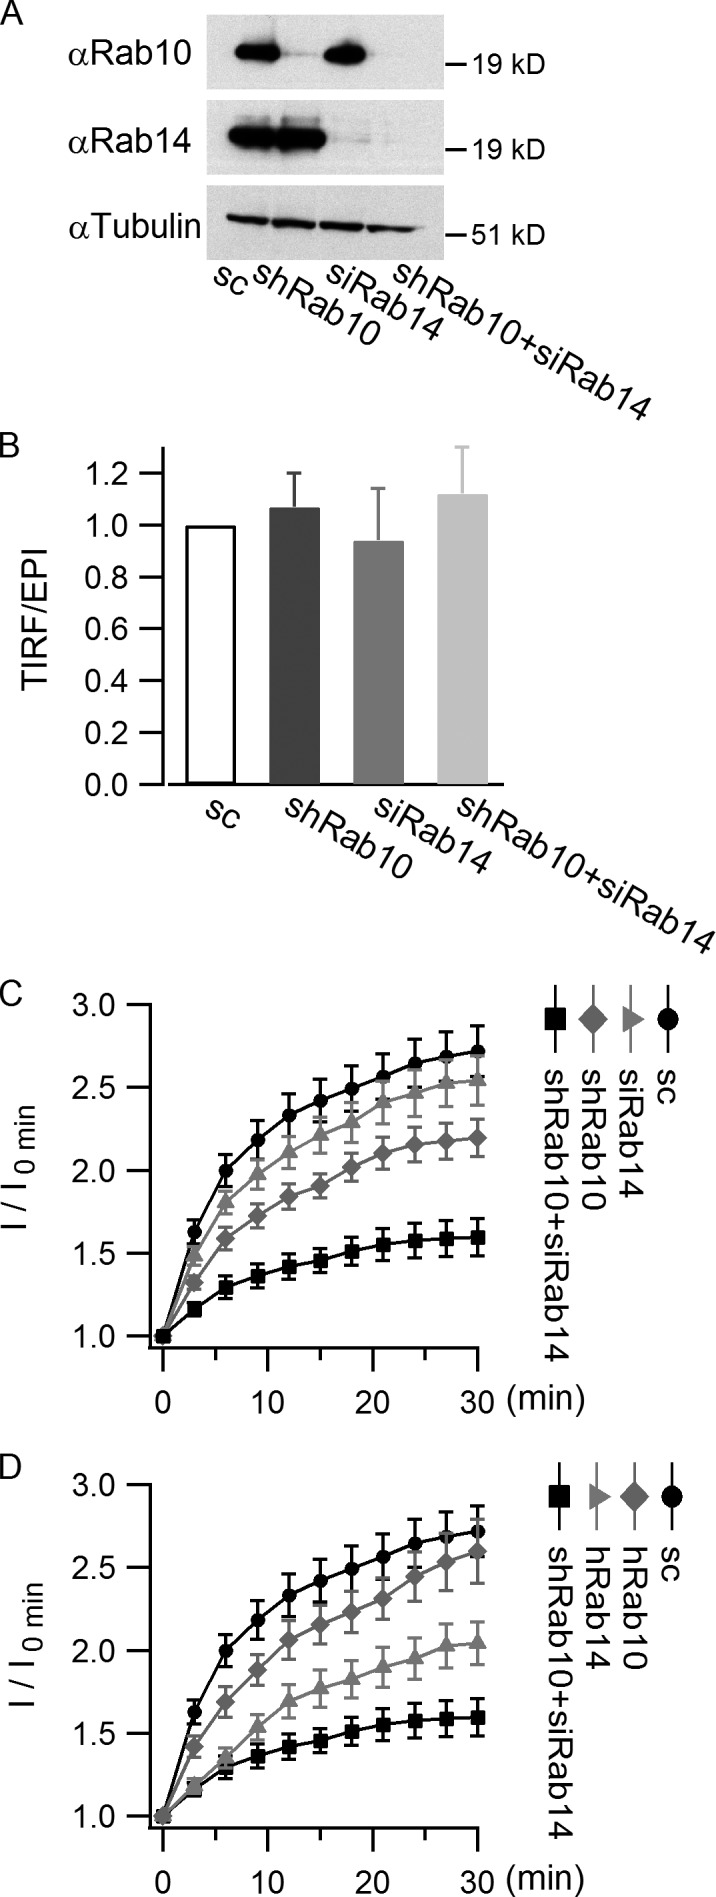
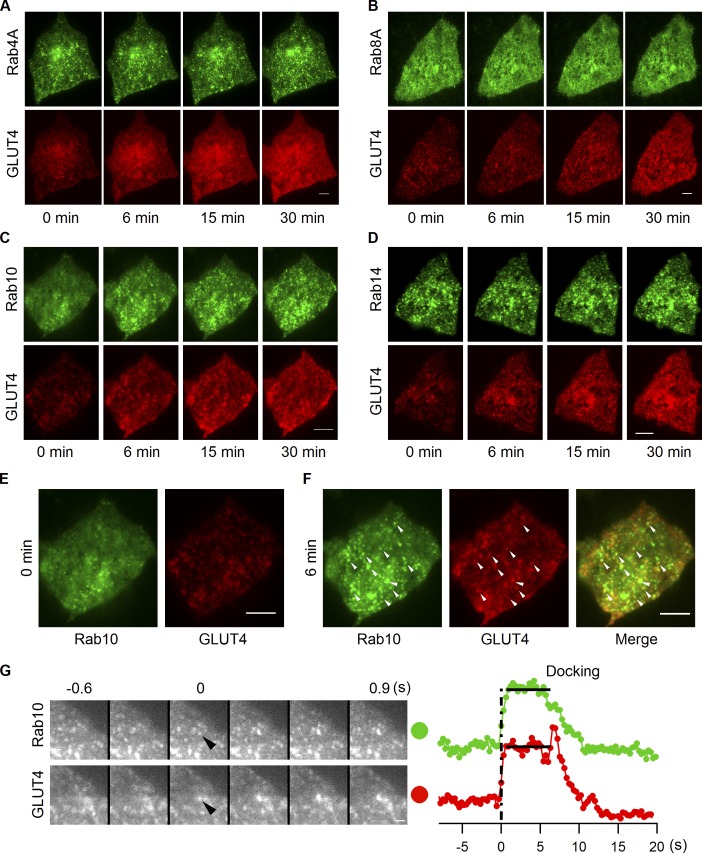
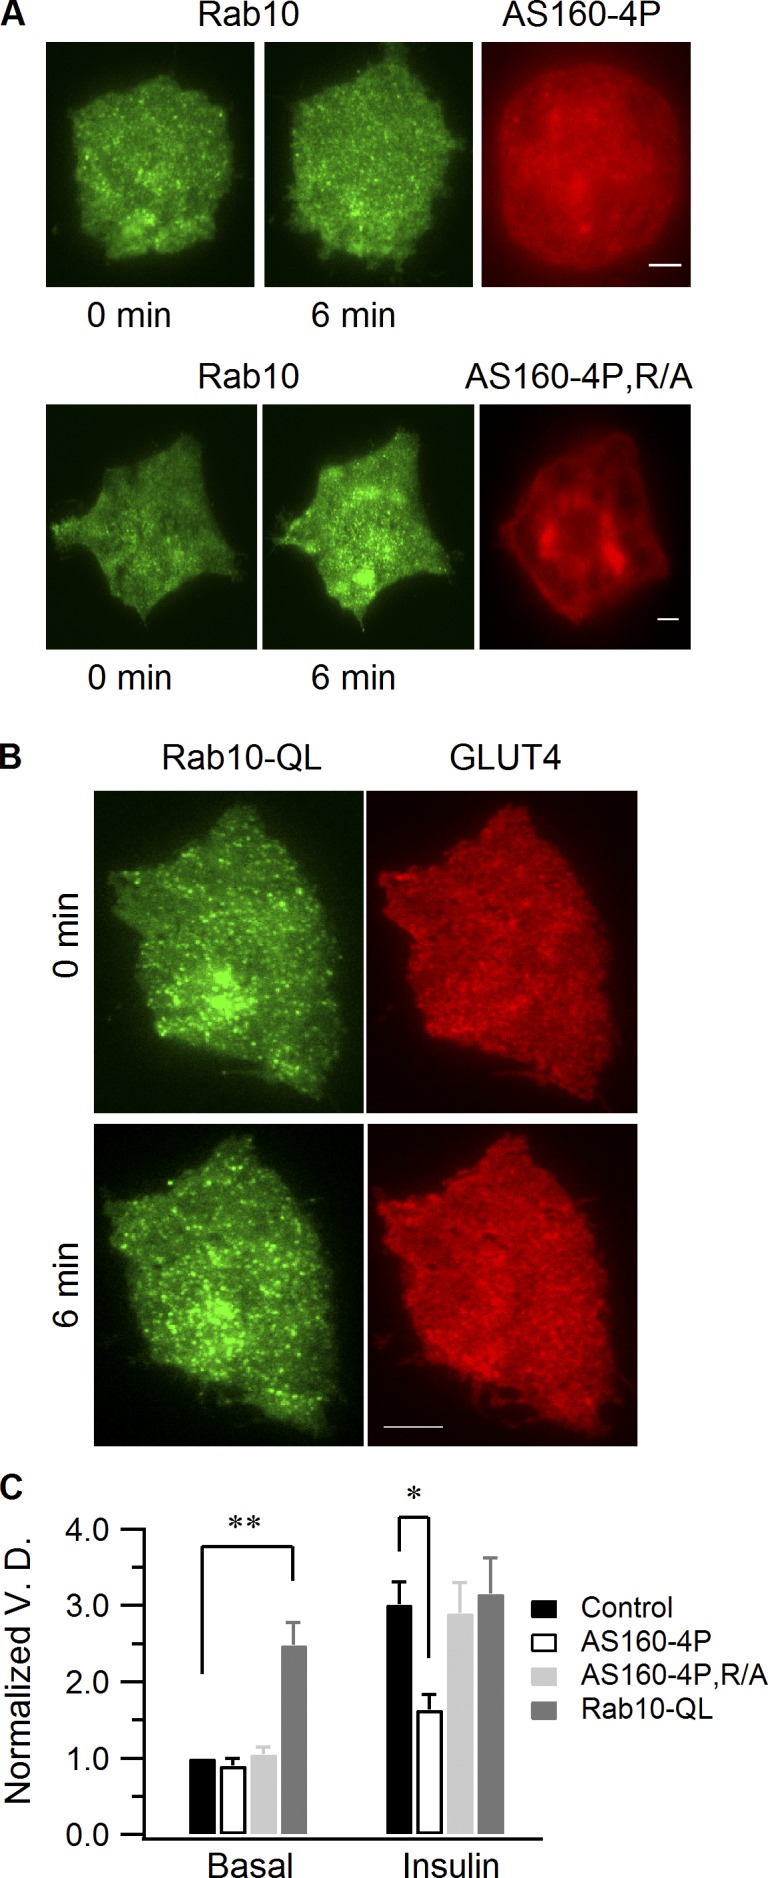
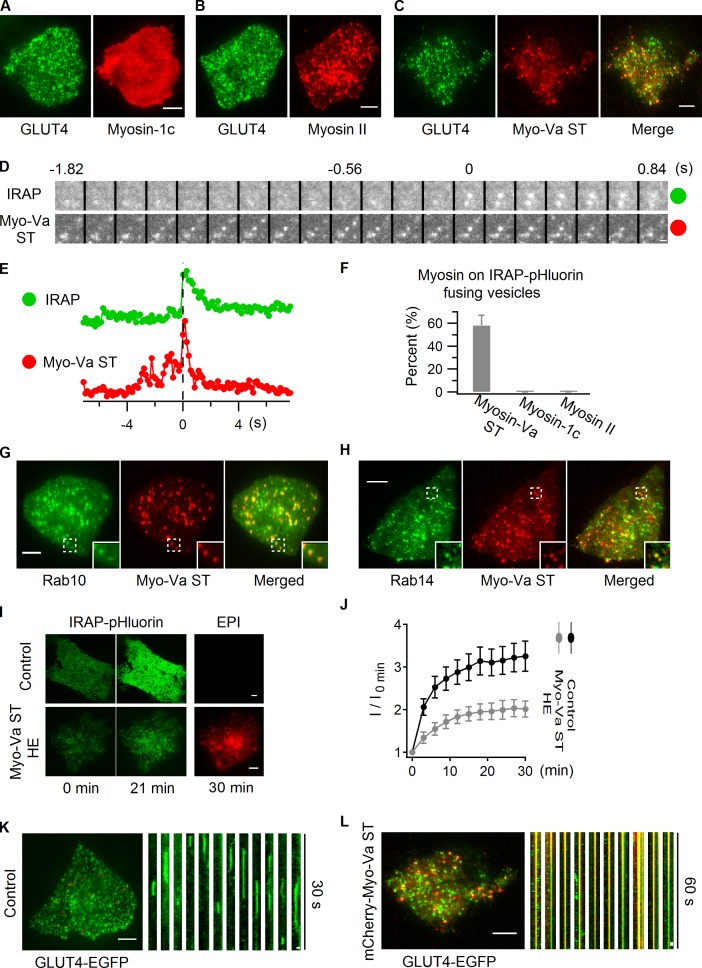
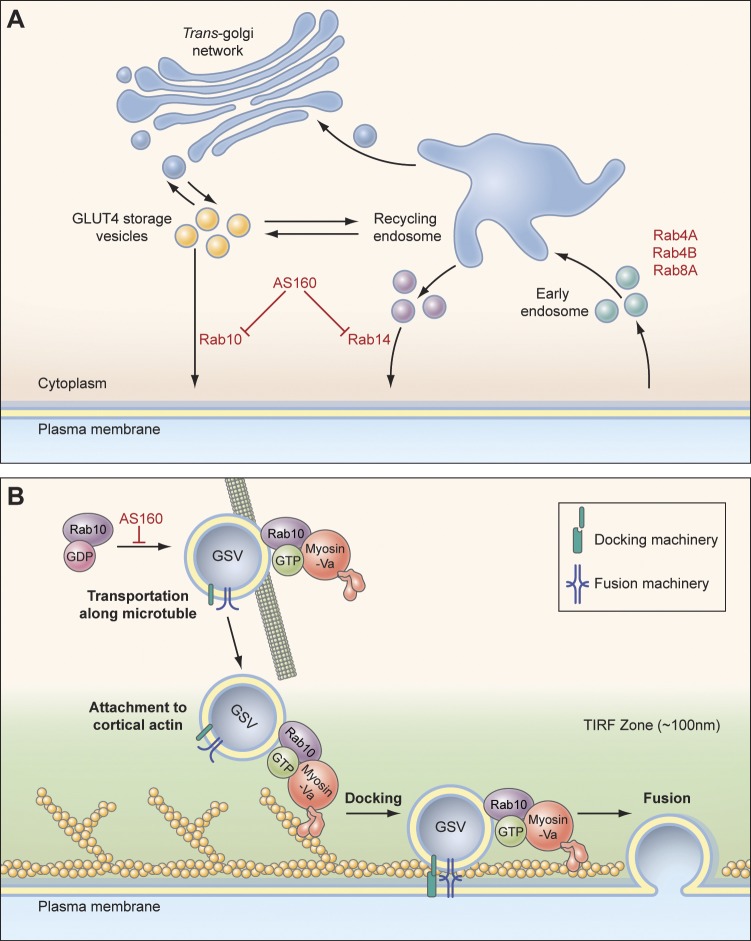
Rab proteins are important regulators of insulin-stimulated GLUT4 translocation to the plasma membrane (PM), but the precise steps in GLUT4 trafficking modulated by particular Rab proteins remain unclear. Here, we systematically investigate the involvement of Rab proteins in GLUT4 trafficking, focusing on Rab proteins directly mediating GLUT4 storage vesicle (GSV) delivery to the PM. Using dual-color total internal reflection fluorescence (TIRF) microscopy and an insulin-responsive aminopeptidase (IRAP)-pHluorin fusion assay, we demonstrated that Rab10 directly facilitated GSV translocation to and docking at the PM. Rab14 mediated GLUT4 delivery to the PM via endosomal compartments containing transferrin receptor (TfR), whereas Rab4A, Rab4B, and Rab8A recycled GLUT4 through the endosomal system. Myosin-Va associated with GSVs by interacting with Rab10, positioning peripherally recruited GSVs for ultimate fusion. Thus, multiple Rab proteins regulate the trafficking of GLUT4, with Rab10 coordinating with myosin-Va to mediate the final steps of insulin-stimulated GSV translocation to the PM.


Figures

Figure 1.
Figure 1.
Multiple Rab proteins reside on GLUT4 vesicles. (A) Rab proteins tagged with EGFP and GLUT4-mCherry were cotransfected into adipocytes, and their colocalization was examined in the absence of insulin stimulation using dual-color TIRF microscopy. Bars, 4 µm. (B) Quantification of Rab protein colocalization with GLUT4 vesicles in the absence of insulin stimulation. All Rab proteins were tagged with mKO and quantified for their colocalization with GLUT4-EGFP vesicles. Rab4A, Rab4B, Rab8A, Rab10, and Rab14, which showed overlap with GLUT4-EGFP vesicles, were then tagged with EGFP and further tested with GLUT4-mCherry. Switching fluorescent protein tags in this manner had no significant effect on the extent of colocalization. v/n, Rab vesicles were observed close to the PM but had no colocalization with GLUT4; n, no Rab vesicle were observed close to the PM; #, Rab proteins that showed frequent docking behavior after insulin stimulation. Data are represented as mean ± SEM (error bars). The number of cells and GLUT4 vesicles analyzed is as follows: Rab4A, n = 3 cells and 144 vesicles; Rab4B, n = 3 cells and 137 vesicles; Rab8A, n = 3 cells and 153 vesicles; Rab10, n = 3 cells and 190 vesicles; and Rab14, n = 3 cells and 140 vesicles. See also Table S1 and Fig. S1. (C) mKO-tagged Rab proteins were transfected into adipocytes, and 3 min after insulin stimulation their movement beneath the PM was compared with insulin-responsive GLUT4-EGFP vesicle docking processes using TIRF microscopy. Bars, 0.64 µm.
Figure 2.
Figure 2.
Full versus partial release of IRAP-pHluorin vesicles at the PM. (A and B) IRAP-pHluorin was transfected into adipocytes. Vesicle fusions at the PM were captured using TIRF microscopy 3 min after insulin stimulation, and fusion rates were quantified. Adipocytes showing no vesicle fusion before insulin stimulation were preferentially chosen, as they usually responded to insulin very well, producing many fusion events after stimulation. (A) The maximum projections of the subtraction image stacks of two videos acquired from the same cell before and 3 min after insulin stimulation. The subtraction image stacks are generated with an interval of 1 frame; each individual fusion event is, therefore, represented by one bright spot in the projection. Bar, 4 µm. (B) The data are represented as mean ± SEM (error bars), n = 3 cells. (C–H) Adipocytes were cotransfected with IRAP-pHluorin and GLUT4-mCherry, and fusion events were analyzed using dual-color TIRF microscopy 3 min after insulin stimulation. (C) A full release event. Intensities measured from the fusion site and the adjacent annulus (see Materials and methods and Fig. S3) are plotted in E. IRAP and GLUT4 were completely released from the vesicle after fusion, with the fusion site intensities having already returned to the background level when the lateral diffusion stopped, as indicated by the annulus intensities dropping back to the background. Bar, 0.5 µm. (D) A partial release event. Intensities measured from the fusion site and the adjacent annulus are plotted in F. Only a small fraction of IRAP and GLUT4 were released from the vesicle during fusion; therefore, GLUT4 intensity of the vesicle was still above the background when annulus intensities of IRAP and GLUT4 returned to the baseline, which indicates closure of the fusion pore and attenuation of lateral diffusion. IRAP-pHluorin intensity of the vesicle had already dropped back to the background level at the time because of vesicular lumen reacidification while GLUT4-mCherry intensity persisted. Bar, 0.5 µm. (G) Summary of full versus partial releases of IRAP-pHluorin vesicles at the PM in adipocytes under insulin stimulation. Data are represented as mean ± SEM, n = 3 cells and 107 fusions. See also Video 1. (H) The presence of GLUT4-mCherry on insulin-stimulated IRAP-pHluorin fusing vesicles. Data are represented as mean ± SEM (error bars), n = 3 cells and 117 fusions.
Figure 3.
Figure 3.
Insulin mobilizes both GSVs and GLUT4-containing endosomal compartments. IRAP-pHluorin and TfR-mCherry were cotransfected into 3T3-L1 fibroblast cells (A and C) and adipocytes (B and D), and IRAP-pHluorin fusion events were monitored using dual-color TIRF microscopy 3 min after insulin stimulation for the presence of TfR on the fusing vesicles. (A) An IRAP-pHluorin fusing vesicle with TfR associated with it observed in a 3T3-L1 fibroblast cell. Intensities within the fusion site were measured from both channels and plotted in C. Bar, 0.5 µm. (B) An IRAP-pHluorin fusion event without TfR association observed in an adipocyte. Intensities within the fusion site were measured from both channels and plotted in D. Bar, 0.5 µm. (E) Summary of the presence of TfR on insulin-stimulated IRAP-pHluorin fusing vesicles in 3T3-L1 fibroblasts and adipocytes. Data are represented as mean ± SEM (error bars). Fibroblasts, n = 3 cells and 28 fusions; adipocytes, n = 3 cells and 104 fusions. See also Fig. S2, and Videos 2 and 3.
Figure 4.
Figure 4.
Rab10 and Rab14 both associate with insulin-stimulated IRAP-pHluorin fusing vesicles. (A–H) Rab4A, Rab8A, Rab10, and Rab14 tagged with TagRFP were separately transfected into adipocytes along with IRAP-pHluorin. IRAP-pHluorin fusion events were monitored using dual-color TIRF microscopy 3 min after insulin stimulation for the presence of a particular Rab protein on the fusing vesicles. (A and E) A Rab4A-negative IRAP-pHluorin fusion event. Fusion site intensities of both channels were measured from A and plotted in E. (B and F) A Rab8A-negative IRAP-pHluorin fusion event. Fusion site intensities of both channels are measured from B and plotted in F. (C and G) A Rab10-positive IRAP-pHluorin fusion event. Fusion site intensities of both channels are measured from C and plotted in G. (D and H) A Rab14-positive IRAP-pHluorin fusion event. Fusion site intensities of both channels are measured from D and plotted in H. Bars, 0.5 µm. (I) Summary of Rab protein associations with insulin-stimulated IRAP-pHluorin fusing vesicles. All Rab proteins were tagged with mKO, and their presence on insulin-stimulated IRAP-pHluorin fusing vesicles was quantified. The association of Rab4A, Rab8A, Rab10, and Rab14 with insulin-stimulated IRAP-pHluorin fusing vesicles was further tested with TagRFP-tagged Rabs. Switching fluorescent protein tags on the Rab proteins had no significant effect on the extent of association. Data are represented as mean ± SEM (error bars). The numbers of cells and insulin-stimulated IRAP-pHluorin fusing vesicles analyzed were as follows: Rab4A, 3 cells and 129 fusions; Rab8A, 3 cells and 136 fusions; Rab10, 3 cells and 143 fusions; and Rab14, 3 cells and 138 fusions. For each of the other Rab proteins, two cells were selected and >60 fusions were examined. The horizontal broken line indicates 20%, which is our threshold for significant association with IRAP-pHluorin fusing vesicles. See also Fig. S3 and Videos 4–7.
Figure 5.
Figure 5.
Rab10 and Rab14 label distinct intracellular compartments. Adipocytes were transfected with EGFP-Rab10 and TagRFP-Rab14 (A and B), TfR-EGFP and TagRFP-Rab10 (C and D), and TfR-EGFP and TagRFP-Rab14 (E and F), and their colocalization was examined using dual-color TIRF microscopy 3 min after insulin stimulation. Vesicles in the first rows (raw image) of A, C, and E were extracted and displayed in the second rows (processed image) to help visualize colocalization between vesicles (see Materials and methods and Fig. S3). Bars, 4 µm. Pixel intensity scatter plots (B, D, and F) of the processed images are to the right of the respective images. The dotted lines indicate 10% of the maximum intensities of different channels, and the percentages of pixels within the upper right regions are indicated.
Figure 6.
Figure 6.
Rab10 and Rab14 mediate GLUT4 translocation in parallel. 3T3-L1 cells infected with HA-GLUT4-EGFP and scrambled shRNA or Rab10 shRNA were differentiated and then transfected with or without Rab14 siRNA. 48 h after transfection, insulin-stimulated GLUT4 translocation was measured using TIRF microscope. (A) Western blots showing knockdown efficiency of Rab10 and Rab14. (B) Loss of Rab10 and/or Rab14 does not change GLUT4 distribution under basal conditions. GLUT4 distribution under basal conditions was measured by the TIRF/epifluorescence (EPI) ratio, and the ratio was normalized to the control value. (C) The effects of loss of Rab10 and/or Rab14 on GLUT4 translocation. Insulin-stimulated GLUT4 translocation was indicated by TIRF image intensities (I) at different time points normalized to the intensity measured before insulin perfusion (I0 min). (D) Restoring Rab10 or Rab14 recovered part of GLUT4 translocation. TagRFP-Rab10 or TagRFP-Rab14 (both of human origin) was cotransfected with Rab14 siRNA into differentiated adipocytes, and GLUT4 translocation was measured 48 h after transfection. Data are represented as mean ± SEM (error bars). Scrambled, n = 37 cells; shRab10, n = 44 cells; siRab14, n = 31 cells; shRab10+siRab14, n = 33 cells; hRab10, n = 26 cells; hRab14, n = 29 cells.
Figure 7.
Figure 7.
Insulin recruits Rab10-marked GSVs to the PM. EGFP-labeled Rab4A (A), Rab8A (B), Rab10 (C), and Rab14 (D) were separately transfected into adipocytes together with GLUT4-mCherry, and their insulin responsiveness was followed using dual-color TIRF microscopy. The first two columns in C are enlarged and displayed in E and F. Representative vesicles positive for both GLUT4 and Rab10 are indicated with arrowheads in F. Bars, 4 µm. (G) Rab10 gets activated and attaches to GSV before the vesicle gets into the TIRF zone. Adipocytes were cotransfected with EGFP-Rab10 and GLUT4-mCherry, and images were taken 3 min after insulin stimulation. Vesicle intensities measured from both channels are plotted on the right, and the docking stage is indicated with horizontal lines. Bars, 1 µm.
Figure 8.
Figure 8.
AS160 regulates Rab10 recruitment by insulin stimulation. (A) Adipocytes were transfected with EGFP-Rab10 and either mCherry-AS160-4P or mCherry-AS160-4P, R/A. Insulin-stimulated Rab10 vesicle recruitment to the cell periphery was followed using TIRF microscopy. AS160 images were taken using the epifluorescence mode. (B) EGFP-Rab10-QL and GLUT4-mCherry were transfected into adipocytes, and dual-color TIRF microscopy images were taken before and 6 min after insulin stimulation. Bars, 4 µm. (C) Rab10 vesicle density quantification. Rab10 vesicle densities were measured before and 6 min after insulin perfusion, and all densities were normalized to the mean of those measured from control cells before insulin stimulation. Data are represented as mean ± SEM (error bars). Control, n = 9 cells; AS160-4P, n = 10 cells; AS160-4P, R/A, n = 9 cells; Rab10-QL, n = 12 cells. **, P < 0.02; *, P < 0.05.
Figure 9.
Figure 9.
Myosin-Va prepares insulin-responsive GLUT4 vesicles for fusion. (A–C) Myosin-1c (A), myosin II (B), and myosin-Va short tail (ST; C) tagged with mCherry were separately transfected into adipocytes together with GLUT4-EGFP, and their colocalization was examined using dual-color TIRF microscopy. Images displayed were taken before insulin stimulation. (D–F) mCherry-tagged myosin-1c, myosin II, and myosin-Va ST were separately transfected into adipocytes together with IRAP-pHluorin. The association of these myosin proteins with IRAP-pHluorin fusing vesicles was monitored using dual-color TIRF microscopy 3 min after insulin stimulation. (D) An IRAP-pHluorin fusing vesicle with myosin-Va ST associated with it. Fusion site intensities are measured from both channels and plotted in E. Also see Video 8. (F) Summary of myosin proteins’ association with insulin-stimulated IRAP-pHluorin fusing vesicles. Data are represented as mean ± SEM (error bars). Myosin-Va ST, n = 3 cells and 122 fusions; for either of myosin-1c and myosin II, 2 cells and >60 fusions were examined. To capture a sufficient number of fusion events when myosin-Va ST was expressed, cells with low expression levels of myosin-Va ST were specifically chosen. (G and H) EGFP-Rab10 and EGFP-Rab14 were separately transfected into adipocytes together with mCherry-myosin-Va ST, and their overlap was examined using dual-color TIRF microscopy 3 min after insulin stimulation. Inset panels show enlarged views of the boxed regions. See also Fig. S5. (I and J) IRAP-pHluorin was transfected alone (Control) or with mCherry-myosin-Va ST into adipocytes, and insulin-stimulated IRAP-pHluorin translocation was followed using TIRF microscopy. Insulin-stimulated IRAP translocation was indicated by TIRF image intensities (I) at different time points normalized to the intensity measured before insulin perfusion (I0 min). Images of myosin-Va ST were taken using the epifluorescence mode. To obtain the optimal inhibitory effect, cells with myosin-Va ST expressed at high levels were specifically chosen (HE, high expression). In J, data are represented as mean ± SEM (error bars). Control, n = 11 cells; Myo-Va ST HE, n = 14 cells. (K and L) GLUT4-EGFP was transfected alone (K) or with mCherry-myosin-Va ST (L) into adipocytes. TIRF microscopy images taken 3 min after insulin stimulation are displayed on the left. The effects of myosin-Va ST association on GLUT4 vesicle dynamics are presented using kymographs on the right. Cells with myosin-Va ST expressed at high levels were specifically chosen for the myosin-Va ST group. Bars: (A–C) 4 µm; (D) 0.5 µm; (G, H, and I) 4 µm; (K and L, left) 4 µm; (K and L, right) 0.5 µm.
Figure 10.
Figure 10.
Schematic models of GLUT4 trafficking in adipocytes. (A) In response to insulin stimulation, Rab10 mediates GLUT4 translocation to the PM via GSVs, and Rab14 does so via TfR-positive endosomal compartments. Rab4A, Rab4B, and Rab8A mediate GLUT4 recycling after endocytosis. (B) After being activated inside the cell, Rab10 attaches to GSVs, recruits myosin-Va, and releases the intracellular retention of the vesicles. GSVs then move along microtubules close to the PM. In the periphery, GSVs transition to actin filaments beneath the PM and use myosin-Va to get into sites on the PM, where docking and fusion machineries are located.

References

    1. Babbey C.M., Ahktar N., Wang E., Chen C.C., Grant B.D., Dunn K.W. 2006. Rab10 regulates membrane transport through early endosomes of polarized Madin-Darby canine kidney cells. Mol. Biol. Cell. 17:3156–3175 10.1091/mbc.E05-08-0799 - DOI - PMC - PubMed
    1. Bai L., Wang Y., Fan J., Chen Y., Ji W., Qu A., Xu P., James D.E., Xu T. 2007. Dissecting multiple steps of GLUT4 trafficking and identifying the sites of insulin action. Cell Metab. 5:47–57 10.1016/j.cmet.2006.11.013 - DOI - PubMed
    1. Bose A., Guilherme A., Robida S.I., Nicoloro S.M., Zhou Q.L., Jiang Z.Y., Pomerleau D.P., Czech M.P. 2002. Glucose transporter recycling in response to insulin is facilitated by myosin Myo1c. Nature. 420:821–824 10.1038/nature01246 - DOI - PubMed
    1. Bryant N.J., Govers R., James D.E. 2002. Regulated transport of the glucose transporter GLUT4. Nat. Rev. Mol. Cell Biol. 3:267–277 10.1038/nrm782 - DOI - PubMed
    1. Chen Y., Wang Y., Ji W., Xu P., Xu T. 2008. A pre-docking role for microtubules in insulin-stimulated glucose transporter 4 translocation. FEBS J. 275:705–712 10.1111/j.1742-4658.2007.06232.x - DOI - PubMed

Publication types