. 2012 Aug 20;198(4):561-74.
doi: 10.1083/jcb.201111136.

T granules in human platelets function in TLR9 organization and signaling

Affiliations

T granules in human platelets function in TLR9 organization and signaling

Jonathan N Thon et al. J Cell Biol. .

Abstract

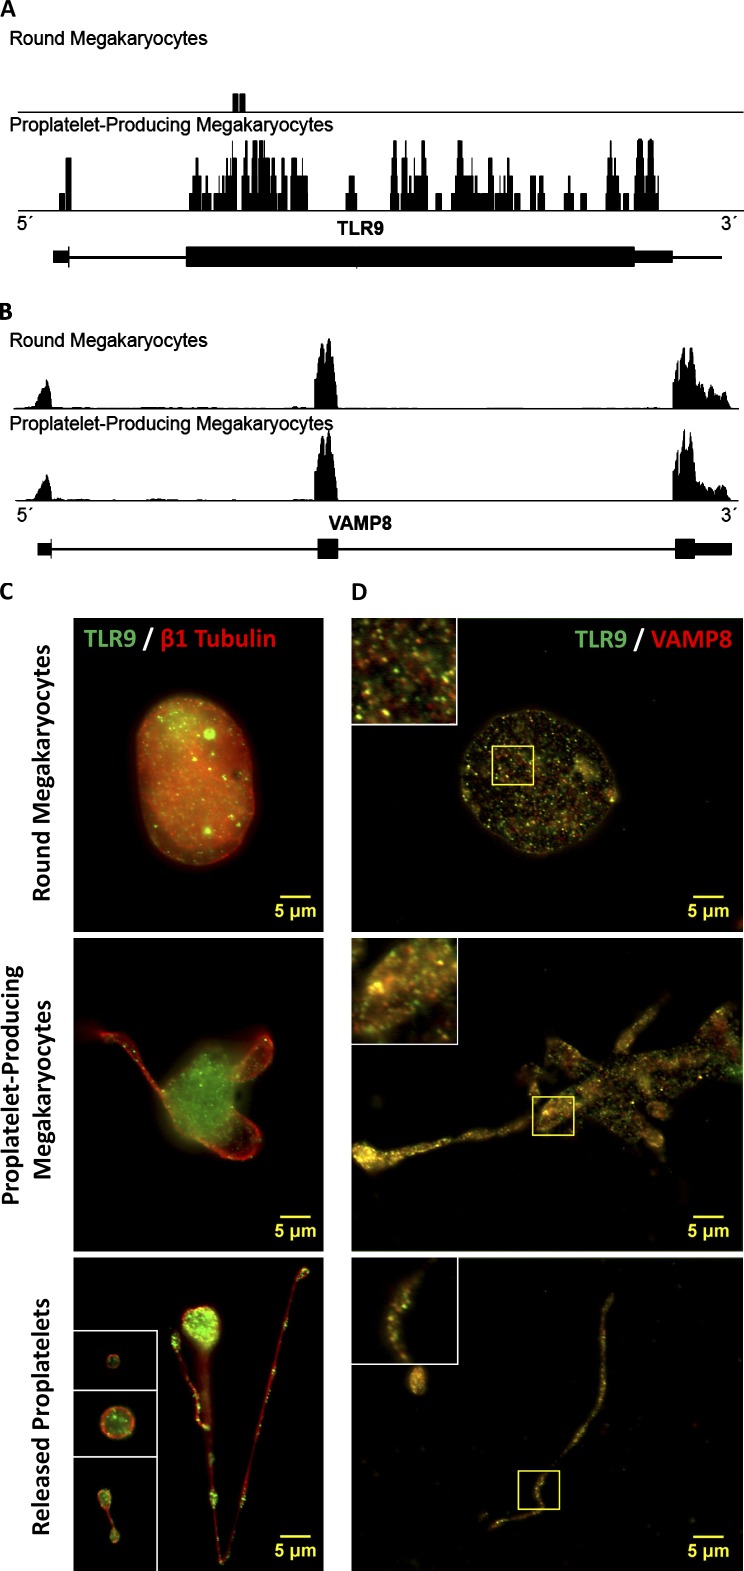
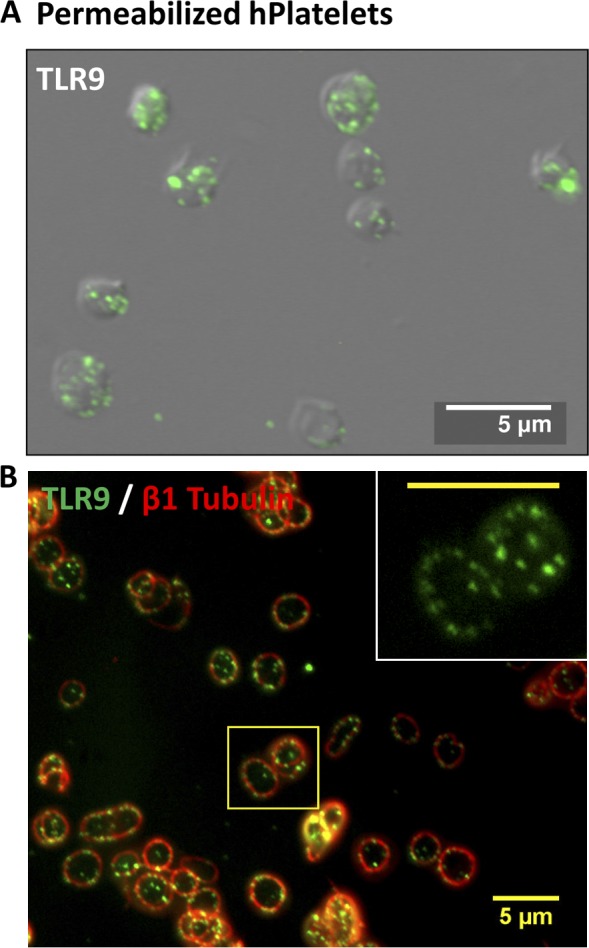
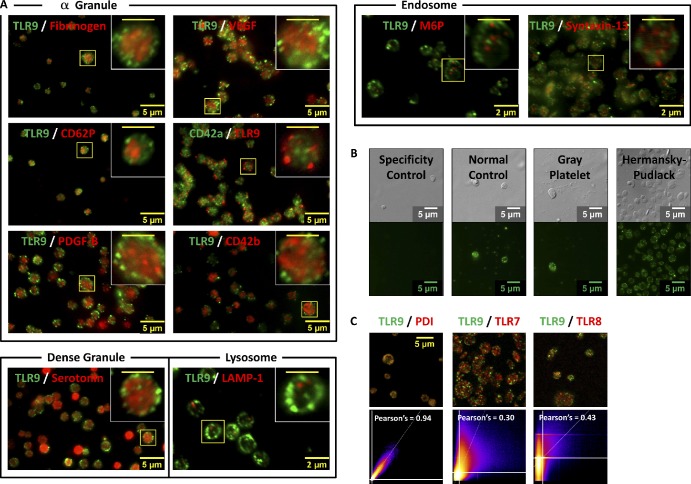
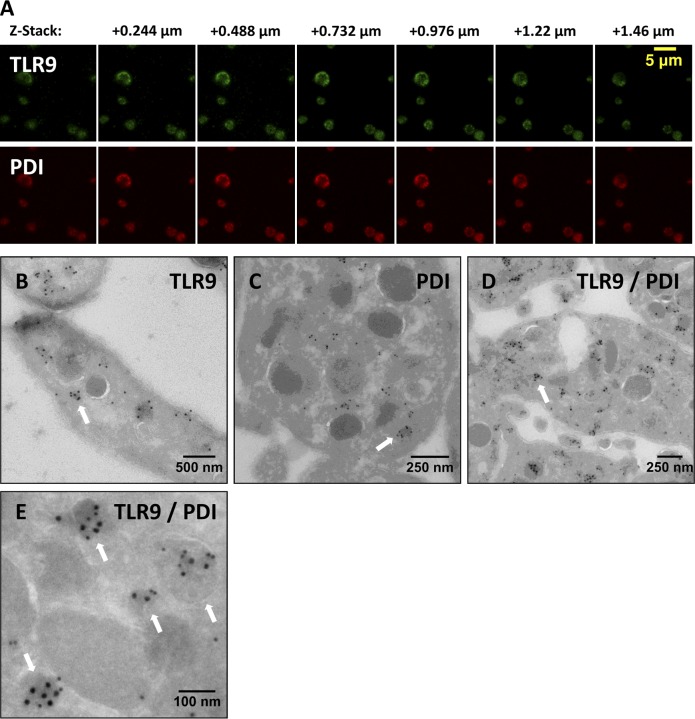
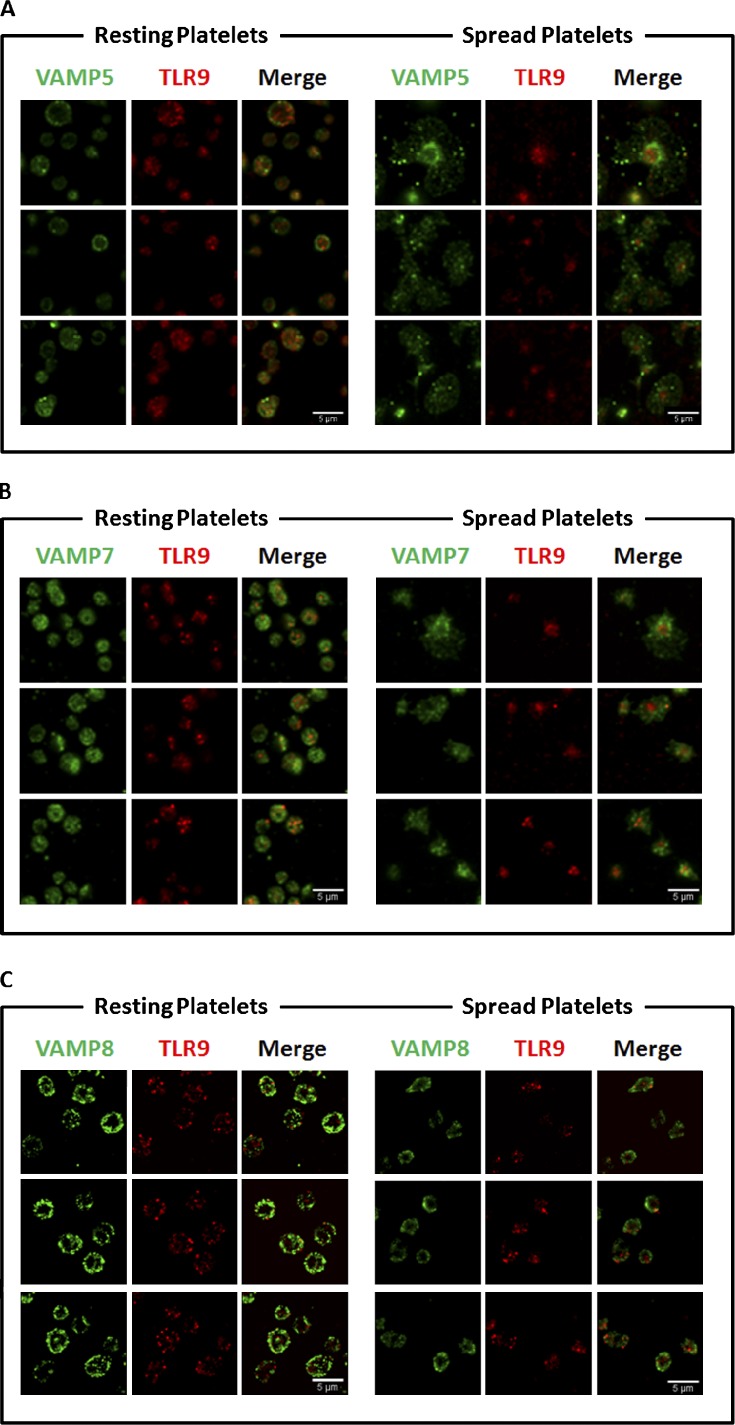
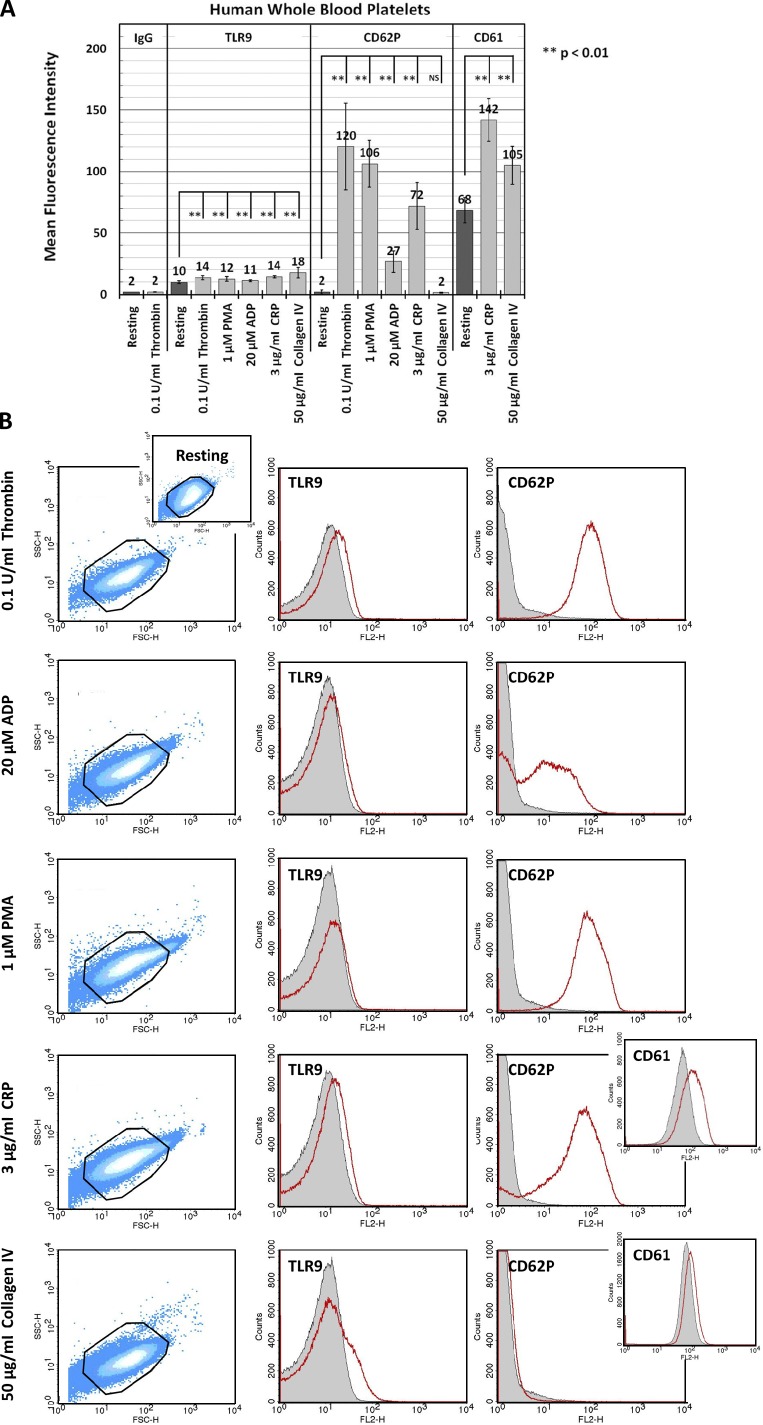
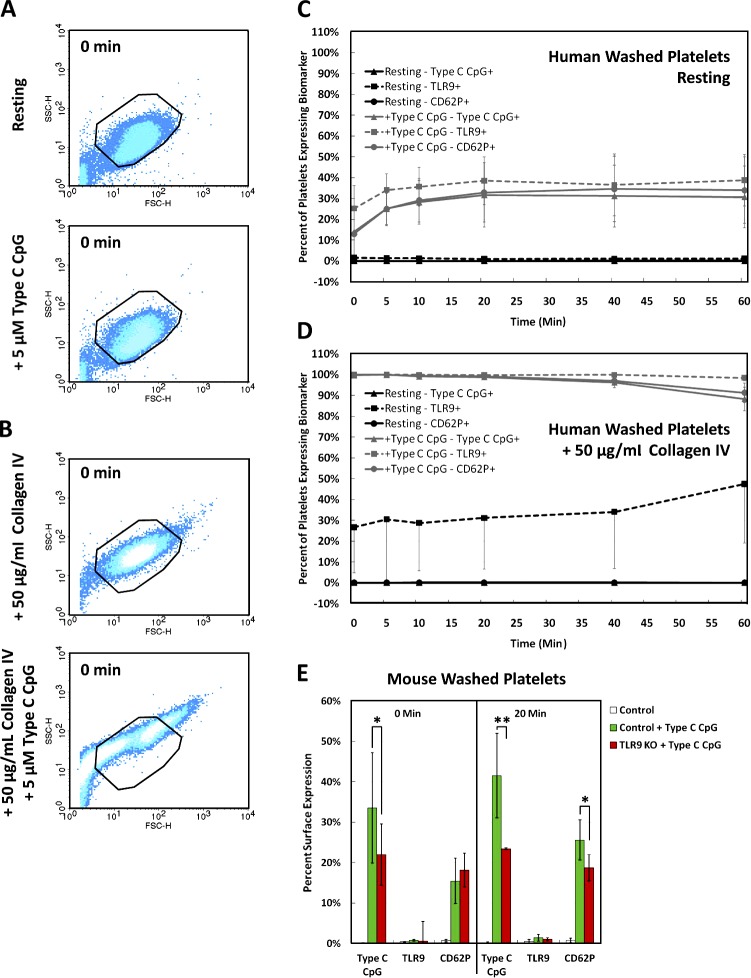
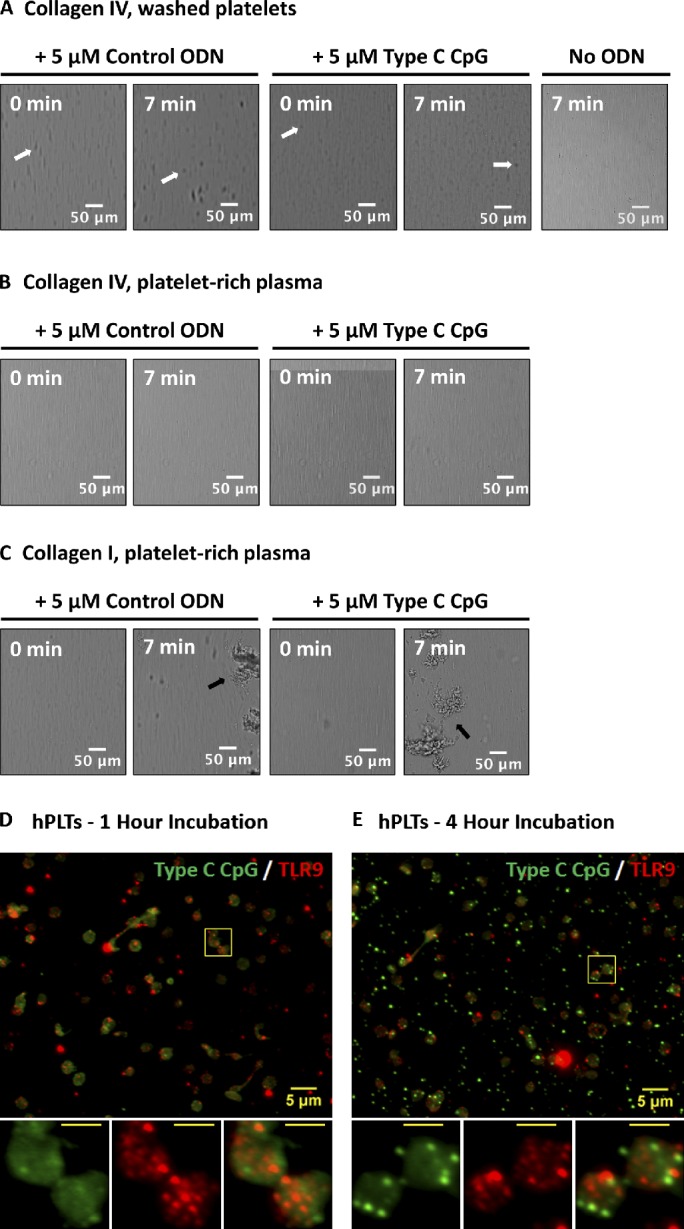
Human and murine platelets (PLTs) variably express toll-like receptors (TLRs), which link the innate and adaptive immune responses during infectious inflammation and atherosclerotic vascular disease. In this paper, we show that the TLR9 transcript is specifically up-regulated during pro-PLT production and is distributed to a novel electron-dense tubular system-related compartment we have named the T granule. TLR9 colocalizes with protein disulfide isomerase and is associated with either VAMP 7 or VAMP 8, which regulates its distribution in PLTs on contact activation (spreading). Preincubation of PLTs with type IV collagen specifically increased TLR9 and CD62P surface expression and augmented oligodeoxynucleotide (ODN) sequestration and PLT clumping upon addition of bacterial/viral ODNs. Collectively, this paper (a) tracks TLR9 to a new intracellular compartment in PLTs and (b) describes a novel mechanism of TLR9 organization and signaling in human PLTs.


Figures

Figure 1.
Figure 1.
MKs up-regulate Tlr9 transcript expression during pro-PLT production and express TLR9 in distinct granules that partially colocalize with VAMP 8 at every stage in thrombocytopoiesis. (A and B) Shown is a screen shot from Integrated Genome Browser of reads distributing to the Tlr9 (A) and Vamp8 (B) locus. The black bars represent piled up sequencing reads aligning to the genomic coordinates encoding the respective RNAs. More reads will align to more highly expressed RNA regions, and the height of the black bars correlates with RNA expression level. Below the read distributions are the RefSeq annotations: thick horizontal lines represent exons, and thin horizontal lines represent introns. Quantification was based on three round MK and four pro-PLT–MK replicates and is expressed in reads per kilobase of exon model per million mapped reads. (C) Intermediates of PLT production from murine fetal liver cell cultures were spun down onto poly-l-lysine–coated glass cover slides, permeabilized with 0.5% Triton X-100 for 5 min, and probed for TLR9 and either β1-tubulin or VAMP 8. Slides were examined by fluorescence microscopy, and image fluorescence intensity is normalized to the round MK fraction. Round MKs, pro-PLT–MKs, released pro-PLTs, and individual PLTs revealed distinct, punctuate/granular localization of TLR9 similar to that observed in whole-blood PLTs. β1-Tubulin antibodies were used to delineate the cell periphery and denote the different intermediate stages in PLT production. Insets (from top to bottom) represent a PLT, pre-PLT, and barbell pro-PLT. (D) Background fluorescence was subtracted, and image brightness/contrast was adjusted linearly for each micrograph to resolve individual granules. TLR9 showed significant colocalization with VAMP 8 in round MKs, along the pro-PLT shafts of pro-PLT–MKs, and within released pro-PLTs and individual PLTs. A Manders’ coefficient of 0.64 was calculated for VAMP 8 colocalization with TLR9 throughout the entirety of MK cell culture. Insets represent the magnified region outlined by the yellow box for each image.
Figure 2.
Figure 2.
Human PLTs express TLR9 in distinct granules along the periphery of the cell, adjacent to the plasma membrane. (A and B) Washed human whole-blood PLTs were spun down onto poly-l-lysine–coated glass cover slides, permeabilized with 0.5% Triton X-100 for 5 min, and were probed for either TLR9 alone or TLR9 and β1-tubulin together. (A) Samples were examined by wide-field fluorescence microscopy and revealed peripheral labeling of TLR9 in distinct, punctate granules that localized mostly (69 ± 5%) along the cell periphery, adjacent to the plasma membrane. (B) TLR9 localization to the cell edge was confirmed in human PLTs by colabeling with β1-tubulin to demarcate the PLT border. Inset represents magnified region outlined by the yellow box. (inset) Bar, 5 µm.
Figure 3.
Figure 3.
TLR9 does not colocalize with known PLT α granule, dense granule, lysosomal, or endosomal markers. Washed human whole-blood PLTs were spun down onto poly-l-lysine–coated glass cover slides, permeabilized with 0.5% Triton X-100 for 5 min, and probed for TLR9. (A) PLTs were colabeled for α granule (fibrinogen, CD62P, PDGF-B, VEGF, CD42a, and CD42b), dense granule (serotonin), lysosome (LAMP-1), or endosome (M6P and syntaxin-13) protein markers using two separate colors. Insets represent magnified regions outlined by the yellow boxes for each image. (B) TLR9 labeling of whole-blood PLTs from patients with Gray PLT and Hermansky–Pudlack syndromes was compared with human normal PLT controls. All samples were examined by wide-field fluorescence microscopy. (C) 2D intensity scatter plot analysis of image overlays reveal that, although TLR9 colocalizes well with PDI, it does not colocalize with either TLR7 or TLR8. These data suggest that TLR9 and PDI may be distributing to a unique intracellular body (T granule) underlying the plasma membrane in resting human PLTs. (insets) Bars, 2 µm.
Figure 4.
Figure 4.
TLR9 colocalizes with PDI to electron-dense membrane-encapsulated regions adjacent the plasma membrane along the periphery of human PLTs. (A) Representative maximum projection z series for TLR9 and PDI by confocal immunofluorescence microscopy demonstrating colocalization. (B–E) Washed human whole-blood PLTs were fixed, frozen, and sectioned before mounting on Formvar carbon-coated copper grids. Ultrathin PLT sections were probed for TLR9, and bound antibody was labeled with immunogold. Samples were examined by electron microscopy and reveal the distribution of TLR9 (B), PDI (C), and colocalization of both (D and E) along the periphery of resting human PLTs. White arrows denote localization of TLR9 and PDI to limiting membrane of electron-dense regions adjacent the plasma membrane. (D and E) For colabeling, immunogold particles are 15 nm for PDI and 10 nm for TLR9.
Figure 5.
Figure 5.
Human PLT TLR9 localization with VAMPs 5, 7, and 8 under resting conditions and when activated (spread) on glass surface. Samples were examined by confocal fluorescence microscopy. Image analysis was completed by using the JACoP (Just Another Colocalization Plugin) plugin for ImageJ as described in Table 1. Manders’ coefficients were used to compare the TLR9 relationship to the associated VAMP. (A) Micrographs demonstrating the relationship of VAMP 5 and TLR9. As demonstrated in the micrographs, in the resting PLT, ∼41% of TLR9 signal overlaps with that of VAMP 5. The portion of overlapping signal slightly increased in the adhered PLTs to 49%. (B) Additional micrographs demonstrating the relationship between VAMP 7 and TLR9. Image analysis confirms 82% of TLR9 overlapped with that of VAMP 7 in the resting PLT; however, upon spreading, the signal decreased to only 56%. (C) Micrographs of resting and spread PLTs probed with specific antiserum for VAMP 8 and TLR9. In the resting PLT, 77% of TLR9 signal overlapped with VAMP 8. Upon spreading, the signal decreased to 67% signal overlap.
Figure 6.
Figure 6.
Human PLTs regulate surface expression of TLR9 on activation with select agonists. Human PLTs were collected from whole blood and examined under resting conditions or after activation with 1 mU/µl thrombin, 1 µM PMA, 3 µg/ml CRP, 20 µM ADP, or 50 µg/ml mouse type IV collagen for 5 min at 37°C. Samples were probed for TLR9 and either CD62P or CD61. PLT mean fluorescence intensity (relative surface expression of targeted receptor) was determined by flow cytometry for at least three different samples, and data were subject to one-way ANOVA and Tukey HSD analysis. Error bars represent one standard deviation about the mean for at least three independent samples. (A) Human PLT activation with all listed agonists results in increased surface expression of TLR9 relative to resting control. Strikingly, TLR9 surface expression on PLT activation did not correlate with CD62P/CD61 expression for the agonists tested and suggests that TLR9 and CD62P/CD61 may localize to separate granules. (B, left) Representative forward scatter versus side scatter dot plots highlight characteristic changes in PLT morphology on activation with the listed agonists relative to resting control. (right) Representative histograms demonstrate a shift in mean fluorescence intensity for TLR9 and CD62P/CD61 on PLT activation. Outlines represent PLT gate used for sample thresholding by forward and side scatter. Mean fluorescence intensity for resting PLTs is represented in gray. Mean fluorescence intensity for agonist-activated PLTs is represented in red.
Figure 7.
Figure 7.
TLR9 signaling results in type C CpG sequestration, increased CD62P surface expression, and PLT clumping. (A and B) Flow cytometric analysis showing representative forward versus side scatter profiles of human washed PLTs under resting conditions and after incubation with synthetic unmethylated type C CpG ODNs (characteristic of bacterial/viral DNA) before (A) and after (B) type IV collagen preincubation. Outlines represent PLT gate used for sample thresholding by forward and side scatter. (C) Quantification of the percentage of PLTs expressing TLR9, CD62P, and type C CpG was normalized to resting levels to resolve the difference on agonist exposure over time. Incubation of resting washed human PLTs with type C CpG ODNs resulted in a 40% increase in TLR9 surface expression followed by a 30% increased type C CpG sequestration and CD62P surface expression over 20 min. (D) Type IV collagen preincubation resulted in considerably increased type C CpG sequestration, CD62P surface expression above resting PLT controls, and significant PLT clumping within 30 s of type C CpG addition. (E) Mouse PLTs show a more pronounced ODN sequestration and comparable CD62P expression after type C CpG incubation. Unlike in human PLTs, TLR9 surface expression is not changed in mice. Although TLR9 KO mice show reduced levels of ODN sequestration and CD62P surface expression 20 min after type C CpG addition, preincubation with type IV collagen still resulted in immediate PLT clumping when type C CpG was added (not depicted). Statistical significance for marked pairings was established using a one-tailed Student’s t test for paired samples (*, P < 0.05; **, P < 0.01). Error bars represent one standard deviation about the mean.
Figure 8.
Figure 8.
ODN-activated PLTs do not form thrombi on collagen type IV and endocytose type C CpG to distinct granules that do not colocalize with TLR9. (A–C) Washed human whole-blood PLTs (A) and PRP (B) were pretreated with 5 µM control ODN, type C CpG ODN, or a vehicle control and perfused at a shear rate of 200 s−1 (flow rate of 18.7 µl/min) over a surface coated with type IV collagen or type I collagen (C) for 10 min. Although addition of ODN to PLTs resulted in PLT clumping in the presence of type IV collagen (white arrows), these did not form thrombi as compared with type I collagen (positive control, black arrows). Addition of type C CpG did not result in increased thrombus formation relative to the ODN control in PRP on the type I collagen-coated surface. (D) PLTs were incubated with FITC-conjugated type C CpG at 37°C and 5% CO2 for a period of ≤4 h. PLTs were subsequently spun down onto poly-l-lysine–coated glass cover slides and probed for TLR9. After 1 h of incubation, the majority of FITC-conjugated type C CpG was associated with the PLT surface and did not colocalize with TLR9. (E) Samples were examined by wide-field fluorescence microscopy. After 4 h of incubation, FITC-conjugated type C CpG became endocytosed by resting human PLTs into distinct granules that showed minimal colocalization with TLR9. Insets represent (from left to right) type C CpG labeling, TLR9 labeling, and colabeling of magnified region outlined by the yellow boxes in the images. (insets) Bars, 2 µm.

References

    1. Ahamed J., Versteeg H.H., Kerver M., Chen V.M., Mueller B.M., Hogg P.J., Ruf W. 2006. Disulfide isomerization switches tissue factor from coagulation to cell signaling. Proc. Natl. Acad. Sci. USA. 103:13932–13937 10.1073/pnas.0606411103 - DOI - PMC - PubMed
    1. Andonegui G., Kerfoot S.M., McNagny K., Ebbert K.V., Patel K.D., Kubes P. 2005. Platelets express functional Toll-like receptor-4. Blood. 106:2417–2423 10.1182/blood-2005-03-0916 - DOI - PubMed
    1. Aslam R., Speck E.R., Kim M., Crow A.R., Bang K.W., Nestel F.P., Ni H., Lazarus A.H., Freedman J., Semple J.W. 2006. Platelet Toll-like receptor expression modulates lipopolysaccharide-induced thrombocytopenia and tumor necrosis factor-alpha production in vivo. Blood. 107:637–641 10.1182/blood-2005-06-2202 - DOI - PubMed
    1. Barton G.M., Kagan J.C., Medzhitov R. 2006. Intracellular localization of Toll-like receptor 9 prevents recognition of self DNA but facilitates access to viral DNA. Nat. Immunol. 7:49–56 10.1038/ni1280 - DOI - PubMed
    1. Bauer S., Kirschning C.J., Häcker H., Redecke V., Hausmann S., Akira S., Wagner H., Lipford G.B. 2001. Human TLR9 confers responsiveness to bacterial DNA via species-specific CpG motif recognition. Proc. Natl. Acad. Sci. USA. 98:9237–9242 10.1073/pnas.161293498 - DOI - PMC - PubMed

Publication types

MeSH terms