. 2012 Aug 20;198(4):695-709.
doi: 10.1083/jcb.201110076.

Wnt-11 and Fz7 reduce cell adhesion in convergent extension by sequestration of PAPC and C-cadherin

Affiliations

Wnt-11 and Fz7 reduce cell adhesion in convergent extension by sequestration of PAPC and C-cadherin

Bianca Kraft et al. J Cell Biol. .

Abstract

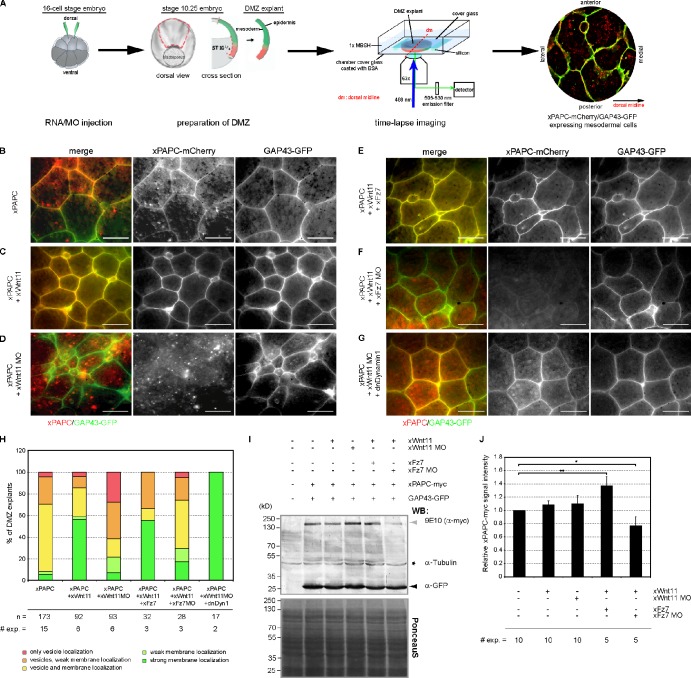
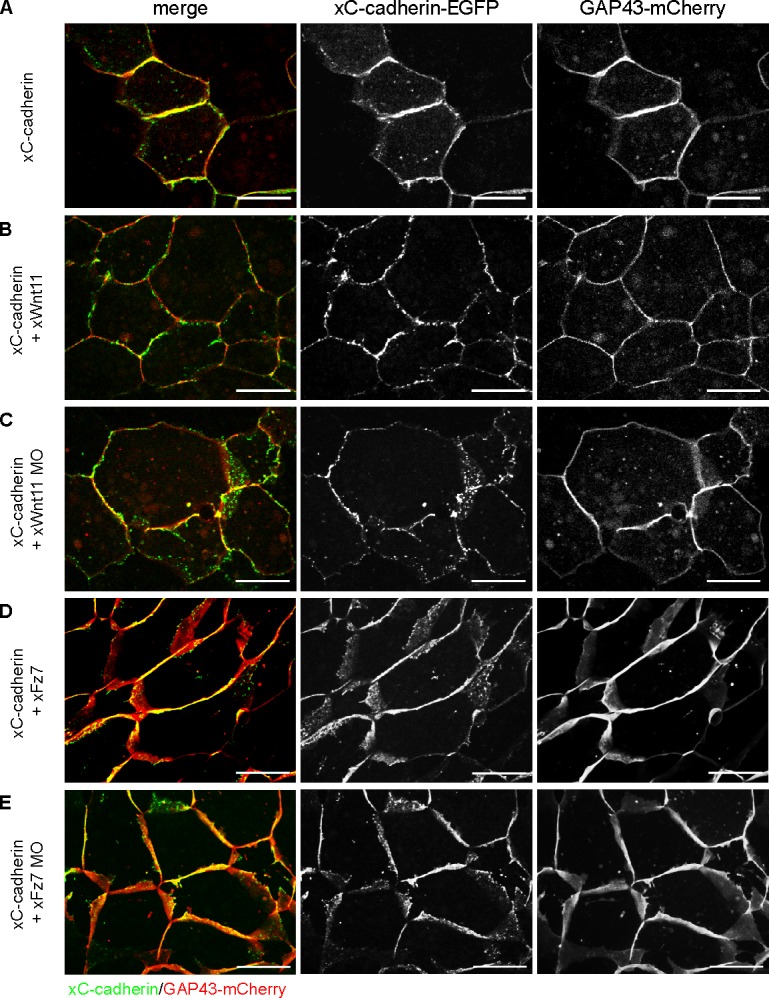
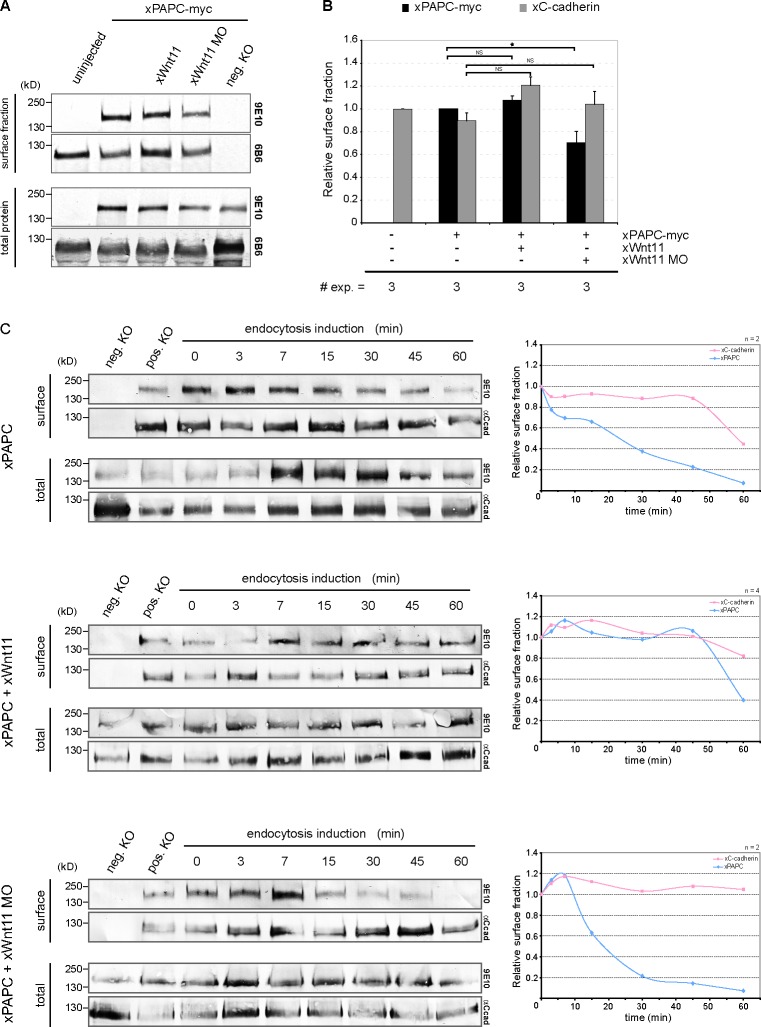
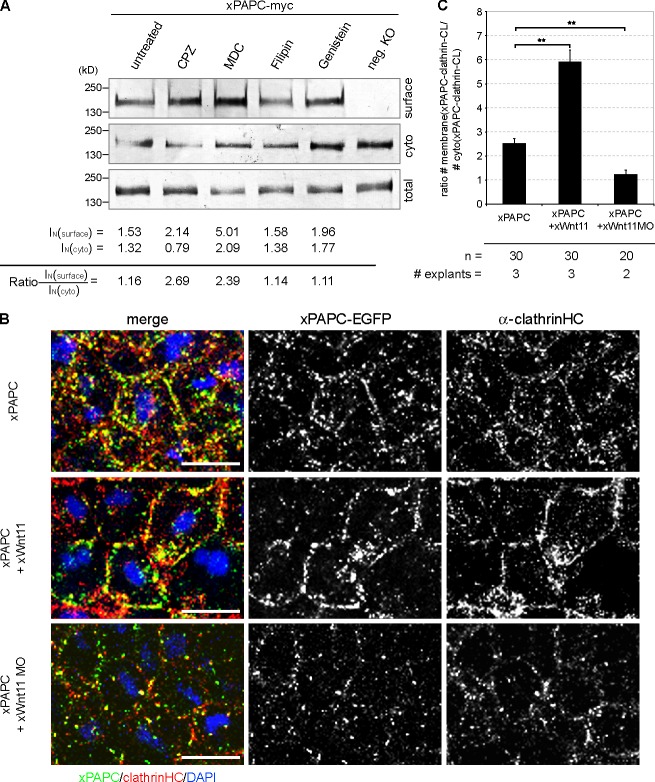
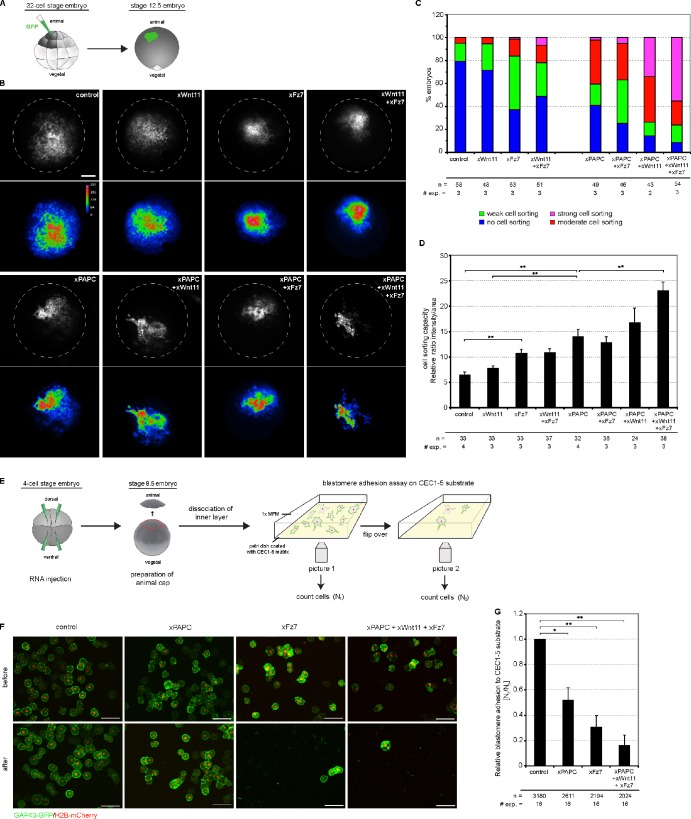
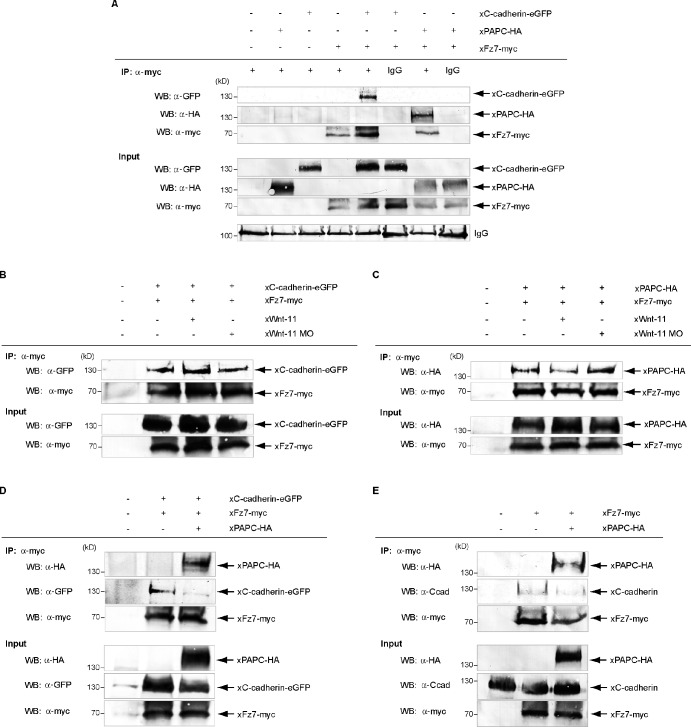
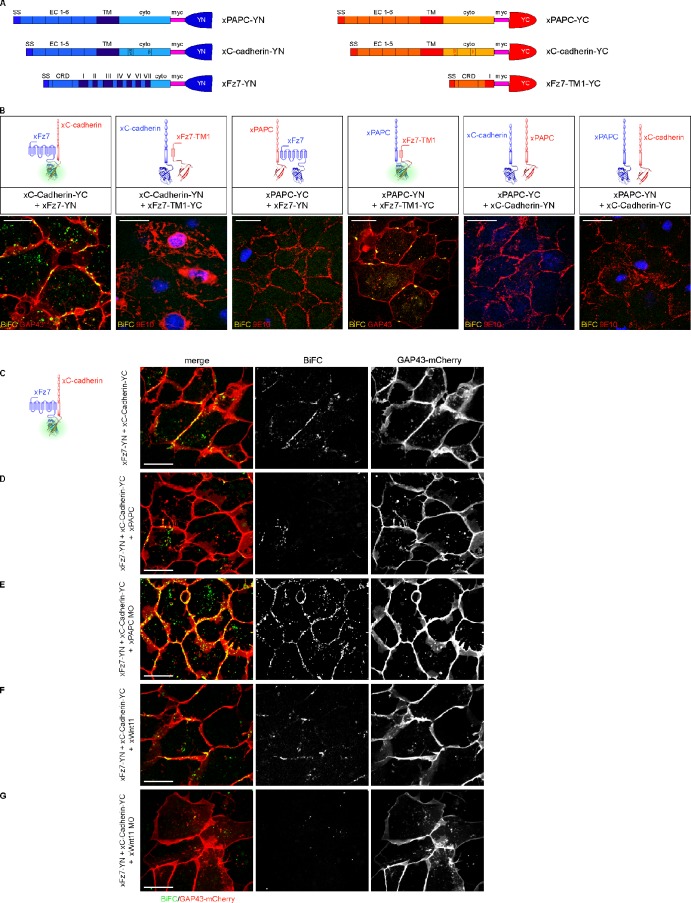
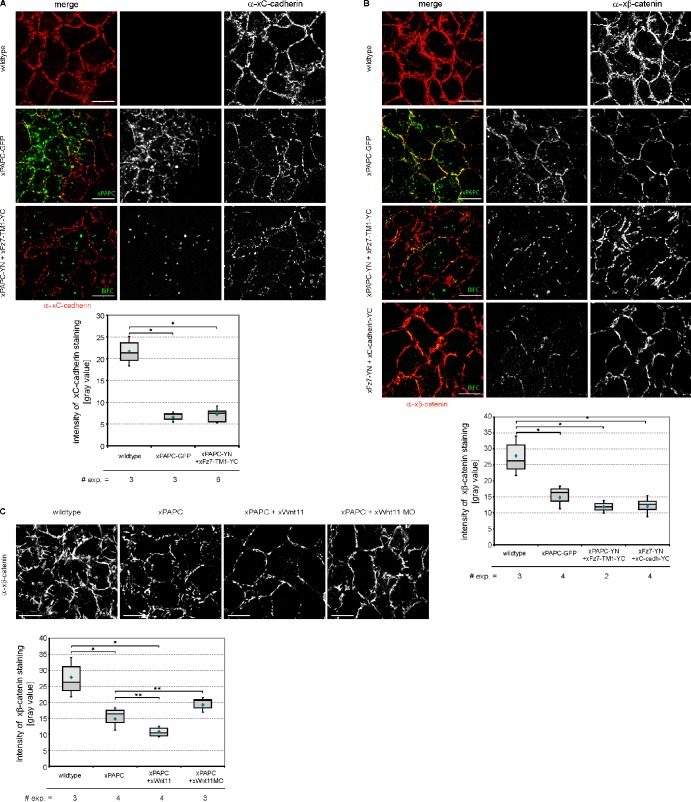
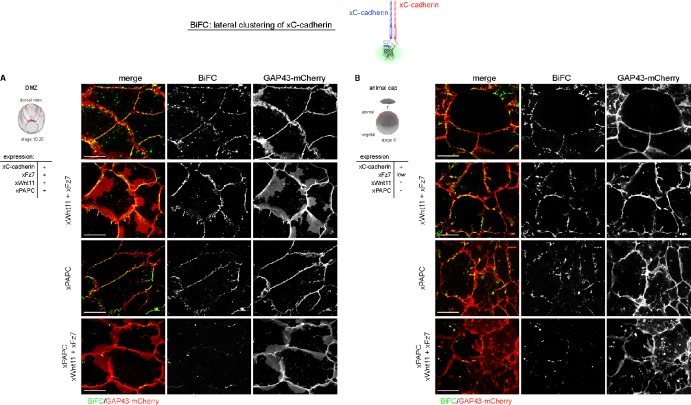
Wnt-11/planar cell polarity signaling polarizes mesodermal cells undergoing convergent extension during Xenopus laevis gastrulation. These shape changes associated with lateral intercalation behavior require a dynamic modulation of cell adhesion. In this paper, we report that Wnt-11/frizzled-7 (Fz7) controls cell adhesion by forming separate adhesion-modulating complexes (AMCs) with the paraxial protocadherin (PAPC; denoted as AMCP) and C-cadherin (denoted as AMCC) via distinct Fz7 interaction domains. When PAPC was part of a Wnt-11-Fz7 complex, its Dynamin1- and clathrin-dependent internalization was blocked. This membrane stabilization of AMCP (Fz7/PAPC) by Wnt-11 prevented C-cadherin clustering, resulting in reduced cell adhesion and modified cell sorting activity. Importantly, Wnt-11 did not influence C-cadherin internalization; instead, it promoted the formation of AMCC (Fz7/Cadherin), which competed with cis-dimerization of C-cadherin. Because PAPC and C-cadherin did not directly interact and did not form a joint complex with Fz7, we suggest that Wnt-11 triggers the formation of two distinct complexes, AMCC and AMCP, that act in parallel to reduce cell adhesion by hampering lateral clustering of C-cadherin.


Figures

Figure 1.
Figure 1.
Wnt-11 regulates PAPC cell membrane localization through Fz7 during convergent extension. (A) Scheme showing time-lapse xPAPC localization analyses in DMZ explants. The two dorsal blastomeres of 16-cell–stage embryos were injected with 500 pg xPAPC-mCherry RNA alone or in combination with 20 pg xWnt-11 RNA, 1 pmol xWnt-11 MO, 500 pg xFz7 RNA, 1.6 pmol xFz7 MO, and/or 500 pg dnDyn1 RNA. 50 pg GAP43-GFP RNA was injected in all samples as a cell membrane tracer. At stage 10.25, DMZ explants were cut, and subcellular localization of xPAPC-mCherry was analyzed. (B–G) Representative images of time-lapse videos are shown. xWnt-11 stabilized xPAPC at the cell membrane, and this activity required xFz7. Bars, 60 µm. (H) Counting of DMZ explants showing xPAPC subcellular localization according the observed phenotypes showed in Fig. S1 A. n, number of DMZ explants. # exp., number of independent experiments. (I) Western blot (WB) analysis of total xPAPC-myc (gray arrowhead) protein amount performed with cell lysates of stage-11 embryos. xWnt-11 did not influence total xPAPC-myc protein amount, whereas xFz7 depletion reduced the overall protein level of xPAPC-myc, even in the presence of xWnt-11. GAP43-GFP (black arrowhead) served as an injection control, α-tubulin (black star) as a loading control, and PonceauS as a transfer control. Injection amount was as follows: 1 ng xPAPC-myc RNA, 40 pg xWnt-11 RNA, 1 pmol xWnt-11 MO, 500 pg xFz7 RNA, 1.6 pmol xFz7 MO, and 100 pg GAP43-GFP RNA. (J) Relative xPAPC-myc signal intensity in dependency of xWnt-11 and xFz7. For more details, see Materials and methods. Error bars show SEM. Student’s t test was performed (*, P < 0.05; **, P < 0.005).
Figure 2.
Figure 2.
C-cadherin surface expression is not affected by Wnt-11 and Fz7. Time-lapse microscopic analysis of xC-cadherin subcellular localization during convergent extension. 16-cell–stage embryos were injected into the DMZ region with 500 pg xC-cadherin–EGPF RNA alone or in combination with 20 pg xWnt-11 RNA, 1 pmol xWnt-11 MO, 500 pg xFz7 RNA, or 1.6 pmol xFz7 MO. 200 pg GAP43-mCherry RNA was coinjected in all samples as a cell membrane tracer. At stage 10.25, DMZ explants were cut, and subcellular localization of xC-cadherin–EGFP was analyzed. (A–E) Representative images of confocal time-lapse videos are shown. Neither overexpression nor depletion of xWnt-11 or xFz7 had an effect on xC-cadherin–EGFP subcellular localization. Bars, 20 µm.
Figure 3.
Figure 3.
Wnt-11 stabilized cell surface PAPC, whereas C-cadherin remained unaffected. (A) Cell surface biotinylation assay performed with DMZ explants. Cell surface and total protein amount of xPAPC-myc (9E10) and endogenous xC-cadherin (6B6) were detected by Western blotting. xWnt-11 depletion reduced cell surface amount of xPAPC-myc, whereas cell surface level of endogenous xC-cadherin was not effected. neg. KO, negative control. (B) Relative cell surface amounts of xPAPC-myc and endogenous xC-cadherin in dependency of xWnt-11, calculated as described in Materials and methods. Error bars show SEM. Student’s t test was performed (*, P < 0.05). # exp., number of independent experiments. (C) Biotin pulse-chase experiment performed with DMZ explants. At the indicated induction times, the residual biotin-labeled (surface) and total protein amount of xPAPC-myc (9E10) and endogenous xC-cadherin (α-Ccad) were detected by Western blotting. Relative surface amounts of xPAPC-myc and endogenous xC-cadherin were plotted over endocytosis induction time. Cell surface xPAPC was stabilized in xWnt-11–overexpressing DMZ explants, whereas xWnt-11 depletion led to a faster degradation of xPAPC membrane fraction. xWnt-11 did not affect the cell surface expression of xC-cadherin. Injection amount was as follows: 1 ng xPAPC-myc RNA, 40 pg xWnt-11 RNA, and 1 pmol xWnt-11 MO. pos. KO, positive control. n, number of independent experiments.
Figure 4.
Figure 4.
Wnt-11 controls PAPC membrane localization by blocking its clathrin-mediated internalization. (A) Cell surface biotinylation assay performed with DMZ explants, injected with 1 ng xPAPC-myc RNA, and treated with clathrin- and caveolin1-specific inhibitors. Cell surface, cytoplasmic (cyto), and total protein amounts of xPAPC-myc were detected by Western blotting using specific myc tag antibody (9E10). The relative xPAPC-myc signal intensity (IN) of cell surface and cytoplasmic fractions were measured as described in Materials and methods. Finally, the ratio surface versus cytoplasmic fraction was calculated. The cell surface amount of xPAPC increased in the presence of clathrin-specific inhibitors. Used clathrin-specific inhibitors were 60 µM chlorpromazine (CPZ) and 300 µM monodansylcadaverine (MDC). Used caveolin1-specific inhibitors were 5 µg/ml filipin and 200 µM genistein. neg. KO, negative control. (B) Confocal microscopic analysis of DMZ explants, cryosectioned, and immunostained for clathrinHC and xPAPC-EGFP. Nuclei were stained with DAPI. xWnt-11 expression resulted in clathrin-xPAPC accumulation at cell membranes. In xWnt-11 morphants, membrane localization of clathrin and PAPC was strongly reduced but increased in intracellular vesicles. Injection amount was as follows: 500 pg xPAPC-EGFP RNA, 20 pg xWnt-11 RNA, and 1 pmol xWnt-11 MO. Bars, 20 µm. (C) Ratio number of membrane versus cytoplasmic colocalization of xPAPC (xPAPC-clathrin-CL) and clathrinHC in dependency of xWnt-11 (for more details, see Materials and methods). Error bars show SEM. Student’s t test was performed (**, P < 0.005). n, number of cells.
Figure 5.
Figure 5.
Wnt-11/Fz7 and PAPC cooperate in decreasing C-cadherin–mediated cell adhesion. (A) Scheme of cell dispersal assay. One animal blastomere of a 32-cell–stage embryo was injected with synthetic mRNAs together with the lineage tracer GAP43-GFP. At stage 12.5, intermingling of GFP-expressing cells was monitored. The patch morphology reflects changes in cell sorting activity as a result of changes in cell adhesion: tight patches with sharp borders and high fluorescence intensity indicate strong cell sorting properties. (B) Cell dispersal assay. Representative images of stage-12.5 embryos. Dashed lines reflect embryo size. Bar, 900 µm. Corresponding pseudocolor images show fluorescence intensity. Relative intensity of fluorescence is indicated by the color bar, where blue and violet represent the lowest and the highest level of detectable fluorescence, respectively. (C) Evaluation of the increasing changes in cell sorting activity. n, number of embryos; # exp., number of experiments. (D) Quantitative evaluation of cell dispersal assay. The diagram displays the cell sorting activity expressed as the relative ratio between intensity and area (for more details, see Fig. S3 and Materials and methods). Error bars indicate SEM. Student’s t test was performed (**, P < 0.005). (E) Scheme of blastomere adhesion assay. Synthetic mRNAs were injected in the animal hemisphere of 4-cell–stage embryos together with the lineage tracers GAP43-GFP and H2B-mCherry. At stage 8.5, animal caps were dissected. The blastomeres of the inner layer were dissociated, spotted on 1 µg/ml CEC1-5–coated substrates, and allowed to adhere. The adhesion strength of blastomeres was measured by the ratio of the number of blastomeres remaining attached after (Nt) versus the number before (N0) flipover of the Petri dish. (F) Representative images of dissociated blastomeres expressing the indicated constructs attached to the CEC1-5 substrate before and after the flipover. Bars, 100 µm. (G) Quantification of the blastomere adhesion assay. The diagram displays the xC-cadherin adhesion index as the relative ratio between blastomeres attached to the CEC1-5 substrate after and before flipover. Injection amount was as follows: 500 pg xPAPC RNA, 500 pg xFz7 RNA, 20 pg xWnt-11 RNA, 100 pg GAP43-GFP RNA, and 250 pg H2B-mCherry RNA. Error bars indicate SEM. Student’s t test was performed (*, P < 0.05; **, P < 0.005). n, number of counted blastomeres.
Figure 6.
Figure 6.
Fz7 complex formation with C-cadherin and PAPC shown by coimmunoprecipitations. For coimmunoprecipitation (co-IP) assays, the indicated constructs were injected into the DMZ of 8-cell–stage embryos. At stage 10.5, DMZ explants were dissected and lysed. In all cases, xFz7 was precipitated with myc antibody (9E10), and complex formation was detected by Western blotting (WB) for the proteins shown (arrows). (A) xPAPC and xC-cadherin coimmunoprecipitations with xFz7. xFz7 interacted with both xC-cadherin and xPAPC. (B and C) xWnt-11–dependent coimmunoprecipitations of xFz7 with xC-cadherin (B) or xPAPC (C). No significant changes could be detected. (D and E) xC-cadherin coimmunoprecipitations with xFz7 in the presence of xPAPC. xPAPC competed with both exogenous (D) and endogenous (E) xC-cadherin for xFz7 complex formation with preference for xPAPC/xFz7 complex. Injection amount was as follows: 1 ng xC-cadherin–EGFP RNA, 1 ng xPAPC-HA RNA, 500 pg xFz7-myc RNA, 40 pg xWnt-11 RNA, and 1 pmol xWnt-11 MO.
Figure 7.
Figure 7.
Fz7 interacts with C-cadherin and PAPC at the cell membrane in vivo, shown by BiFC. (A) Primary structure of the different split YFP constructs used in the BiFC assay. The putative interacting partners were either fused to YFP fragment consisting of the first N-terminal 155 amino acids (YN) or the last C-terminal 83 amino acids (YC) of YFP. All constructs contained a myc tag that served as a control for successful expression. β, β-catenin binding site; CRD, cysteine-rich domain; cyto, cytoplasmic region; EC, extracellular cadherin repeat; p120, p120 binding site; SS, signal peptide sequence; TM, transmembrane domain. (B) Expression of different combinations of the split YFP constructs in DMZ explants to monitor complex formation in vivo during convergent extension. DMZ explants were either coinjected with GAP43-mCherry (GAP43) to label cell membranes or fixed and fluorescently immunostained for split YFP constructs using myc antibody (9E10) to control their successful expression. Nuclei were stained with DAPI. Protein–protein interaction was displayed by the YFP fluorescence (BiFC). Full-length xFz7 interacted with xC-cadherin, whereas xFz7-TM1 interacted with xPAPC at the cell membranes. No direct interaction between xC-cadherin and xPAPC was observed. (C–G) In vivo xFz7–xC-cadherin complex formation in the presence or absence of xPAPC or xWnt-11. Cell membranes were labeled with GAP43-mCherry, and protein–protein interaction was displayed by YFP fluorescence (BiFC). Depletion of xPAPC promoted the interaction between xFz7 and xC-cadherin, whereas in Wnt11 morphants, xFz7–xC-cadherin complex formation was abolished. Injection amount was as follows: 1 ng xPAPC-YN/YC RNA, 1 ng xC-cadherin-YC/YN RNA, 500 pg xFz7-YN RNA, 500 pg xFz7-TM1-YC, 20 pg xWnt-11 RNA, 1 pmol xWnt-11 MO, 1 ng xPAPC RNA, 1.6 pmol xPAPC MO, and 200 pg GAP43-mCherry RNA. Bars, 20 µm.
Figure 8.
Figure 8.
PAPC–Fz7 and C-cadherin–Fz7 interactions reduce cadherin–catenin complexes at cell membranes. DMZ explants were injected with the indicated constructs, fixed, and fluorescently immunostained using either specific xC-cadherin (6B6) or xβ-catenin antibody (PGDS 7D12). (A, top) Fluorescent immunostainings for endogenous xC-cadherin. Endogenous xC-cadherin membrane staining was reduced upon xPAPC-GFP expression and upon formation of the xPAPC–xFz7–TM1 complex (BiFC). (bottom) Quantitative evaluation of endogenous xC-cadherin staining. The mean grayscale value (intensity) of xC-cadherin staining was measured and plotted into box and whisker diagrams (box plots). For more details, see Materials and methods. (B and C) Fluorescent immunostainings for endogenous xβ-catenin. Endogenous xβ-catenin membrane staining was reduced upon xPAPC-GFP expression and upon formation of the xPAPC–xFz7–TM1 and xC-cadherin–xFz7 complexes. xPAPC-induced reduction of xβ-catenin could be restored by Wnt-11 depletion. The graphs show quantitative evaluation of endogenous xβ-catenin staining. The mean grayscale value (intensity) of xβ-catenin staining was measured and plotted into box and whisker diagrams (box plots). Injection amount was as follows: 1 ng xPAPC-GFP RNA, 1 ng xPAPC-YN RNA, 1 ng xC-cadherin–YC RNA, 500 pg xFz7-YN RNA, 500 pg xFz7-TM1-YC, 20 pg xWnt-11 RNA, and 1 pmol xWnt-11 MO. Bars, 20 µm. In the box plots, each box represents the values between the 25th (dark gray) and 75th quartiles (light gray). The line within the boxes indicates the median values, and the blue rhombi show the mean values. Error bars indicate SEM. Student’s t test was performed (*, p < 0.05 to wild type; **, p < 0.05 to xPAPC). # exp., number of experiments.
Figure 9.
Figure 9.
Lateral cis-dimerization of C-cadherin is reduced by coexpression of Wnt-11, Fz7, and PAPC in animal caps and DMZ explants. (A and B) In vivo monitoring of lateral clustering of xC-cadherin by expression of the split YFP xC-cadherin constructs in DMZ explants (A) and in animal caps (B). Cell membranes were labeled in all samples with GAP43-mCherry. Whereas xWnt-11/xFz7 and xPAPC alone had no apparent effect, the combination of all three reduced lateral clustering of xC-cadherin. Injection amount was as follows: 1 ng xC-cadherin–YC/YN RNA, 500 pg xFz7 RNA, 500 pg xPAPC RNA, or 20 pg xWnt-11 RNA. Bars, 20 µm.

Similar articles

Cited by

References

    1. Abu-Elmagd M., Garcia-Morales C., Wheeler G.N. 2006. Frizzled7 mediates canonical Wnt signaling in neural crest induction. Dev. Biol. 298:285–298 10.1016/j.ydbio.2006.06.037 - DOI - PubMed
    1. Brieher W.M., Yap A.S., Gumbiner B.M. 1996. Lateral dimerization is required for the homophilic binding activity of C-cadherin. J. Cell Biol. 135:487–496 10.1083/jcb.135.2.487 - DOI - PMC - PubMed
    1. Chen X., Gumbiner B.M. 2006. Paraxial protocadherin mediates cell sorting and tissue morphogenesis by regulating C-cadherin adhesion activity. J. Cell Biol. 174:301–313 10.1083/jcb.200602062 - DOI - PMC - PubMed
    1. Chen X., Molino C., Liu L., Gumbiner B.M. 2007. Structural elements necessary for oligomerization, trafficking, and cell sorting function of paraxial protocadherin. J. Biol. Chem. 282:32128–32137 10.1074/jbc.M705337200 - DOI - PubMed
    1. Chen X., Koh E., Yoder M., Gumbiner B.M. 2009. A protocadherin-cadherin-FLRT3 complex controls cell adhesion and morphogenesis. PLoS ONE. 4:e8411 10.1371/journal.pone.0008411 - DOI - PMC - PubMed

Publication types

MeSH terms