. 2012 Aug 27;209(9):1671-87.
doi: 10.1084/jem.20111706. Epub 2012 Aug 20.

MyD88 inhibition amplifies dendritic cell capacity to promote pancreatic carcinogenesis via Th2 cells

Affiliations

MyD88 inhibition amplifies dendritic cell capacity to promote pancreatic carcinogenesis via Th2 cells

Atsuo Ochi et al. J Exp Med. .

Abstract

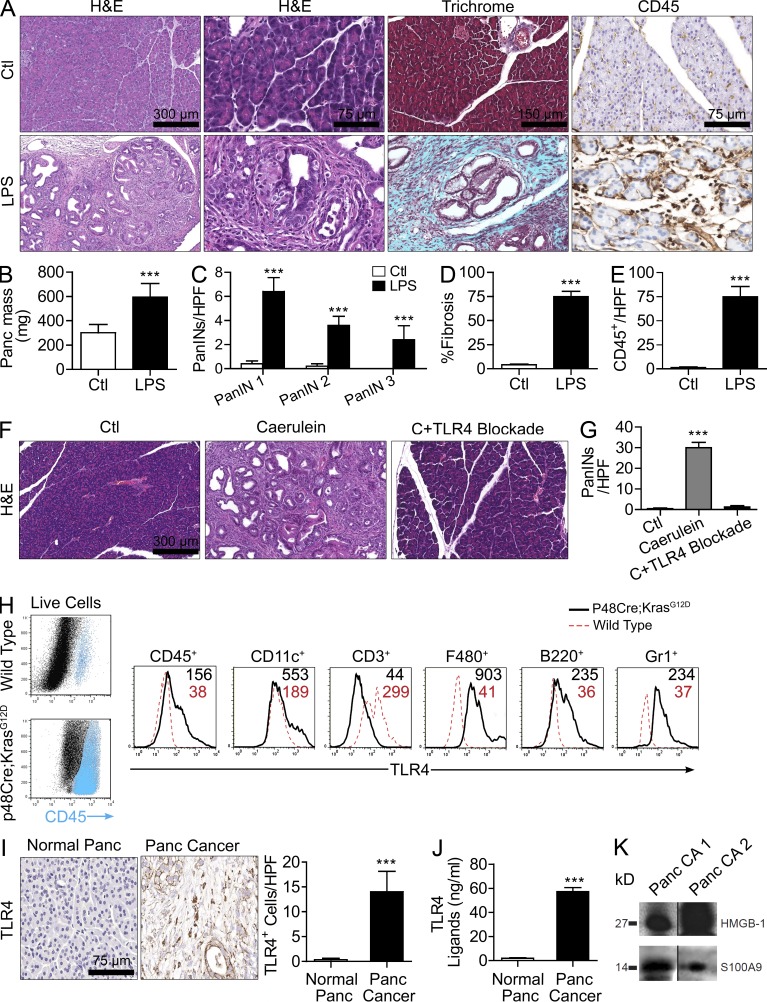
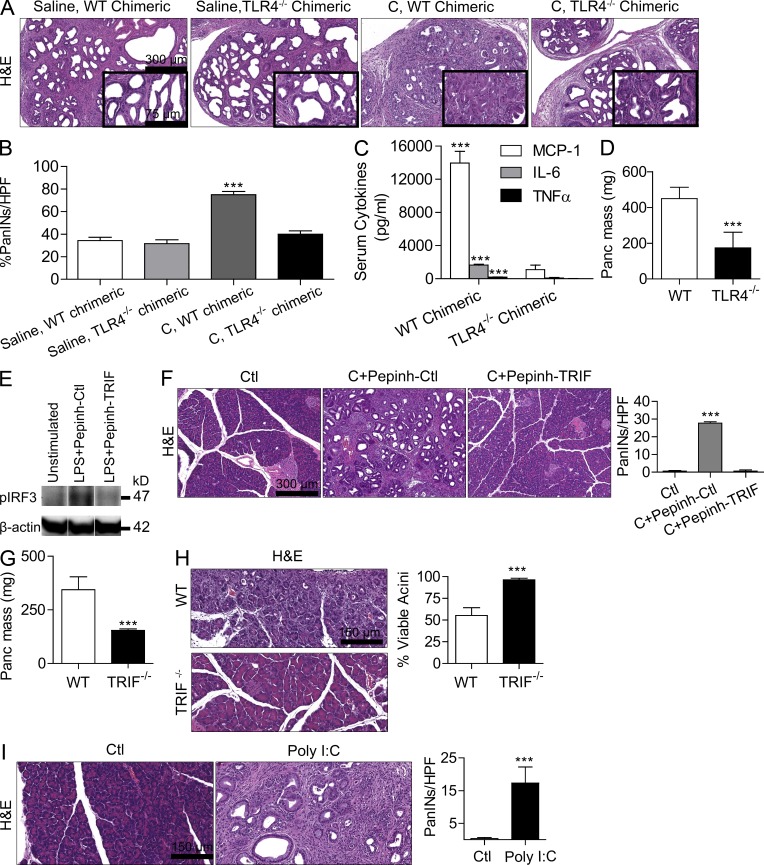
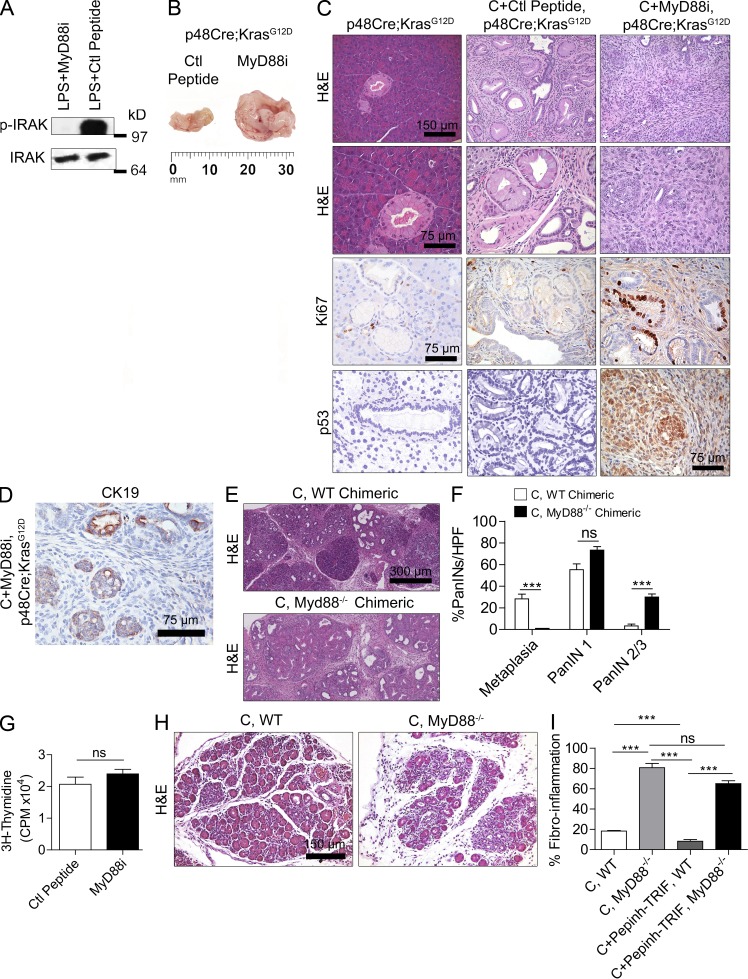
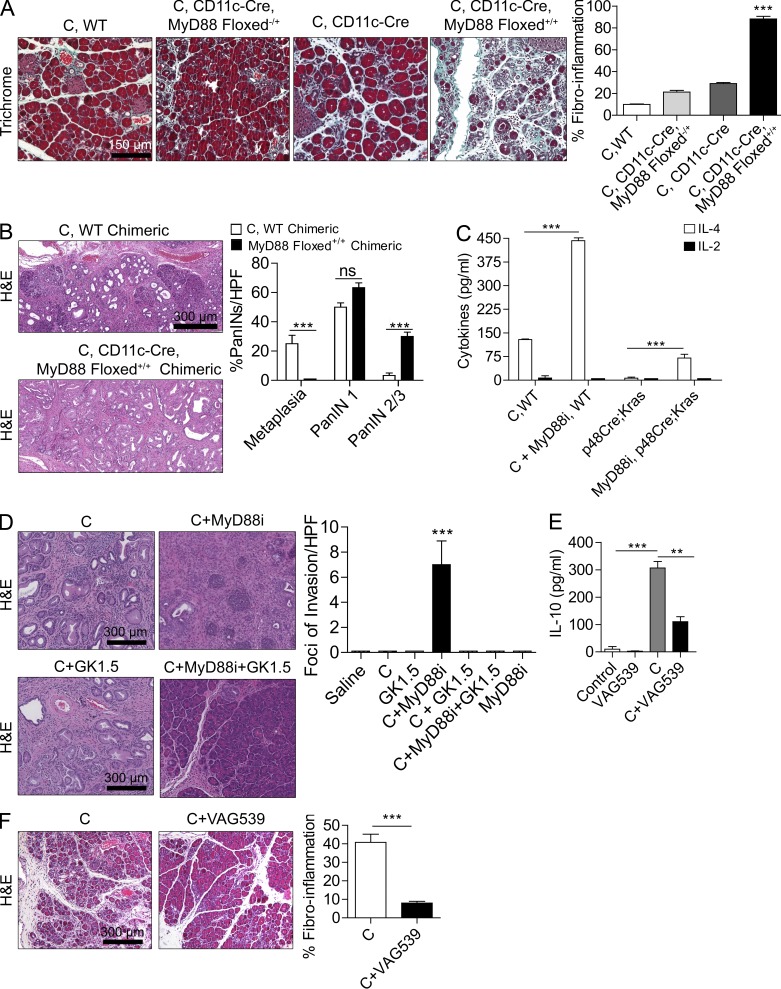
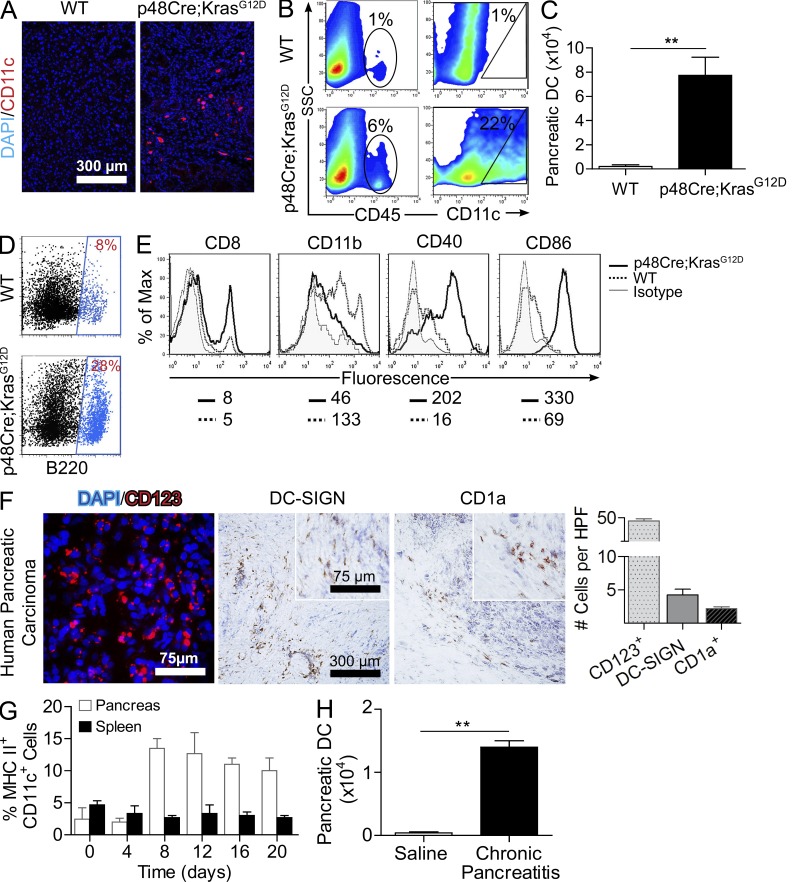
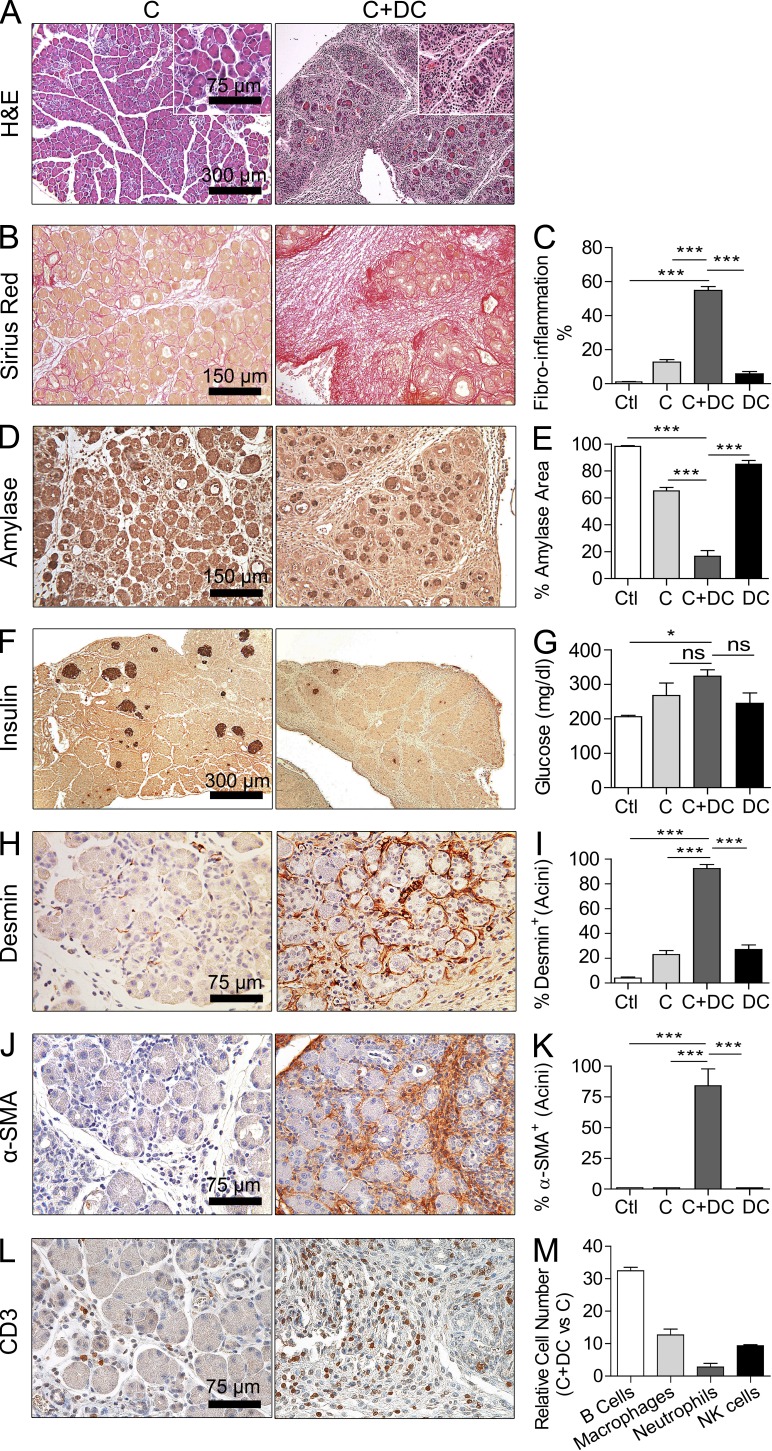
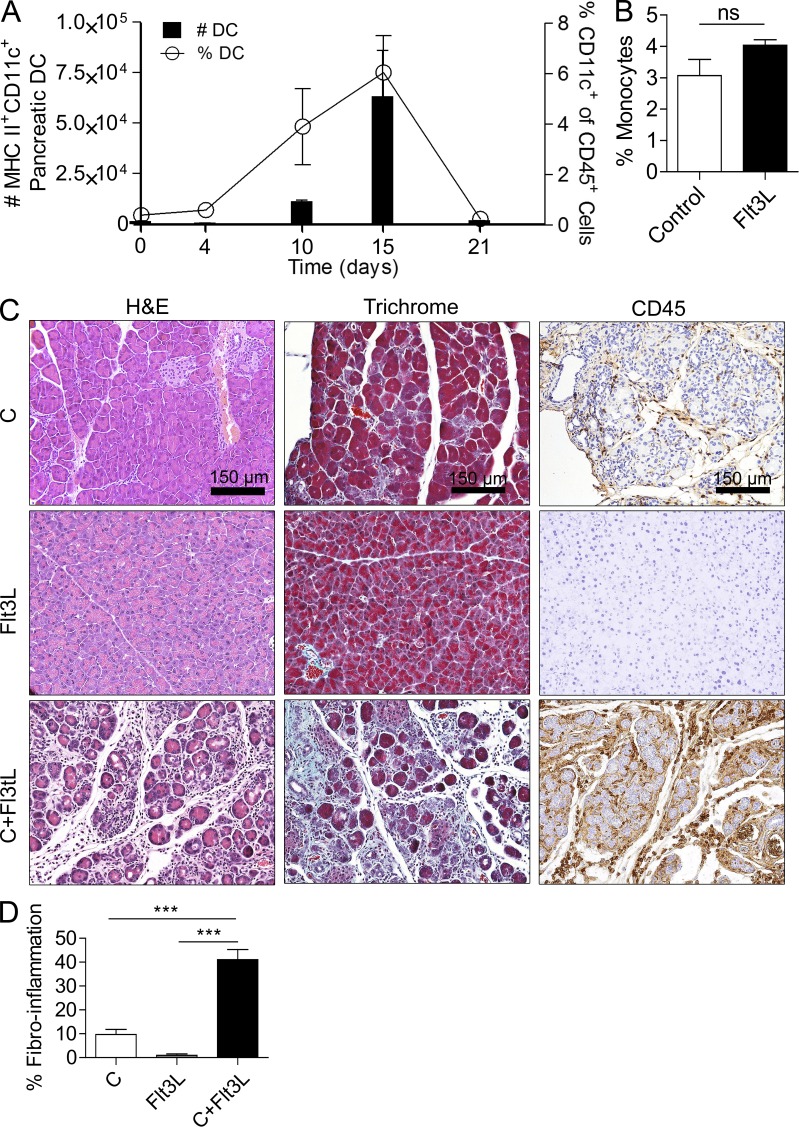
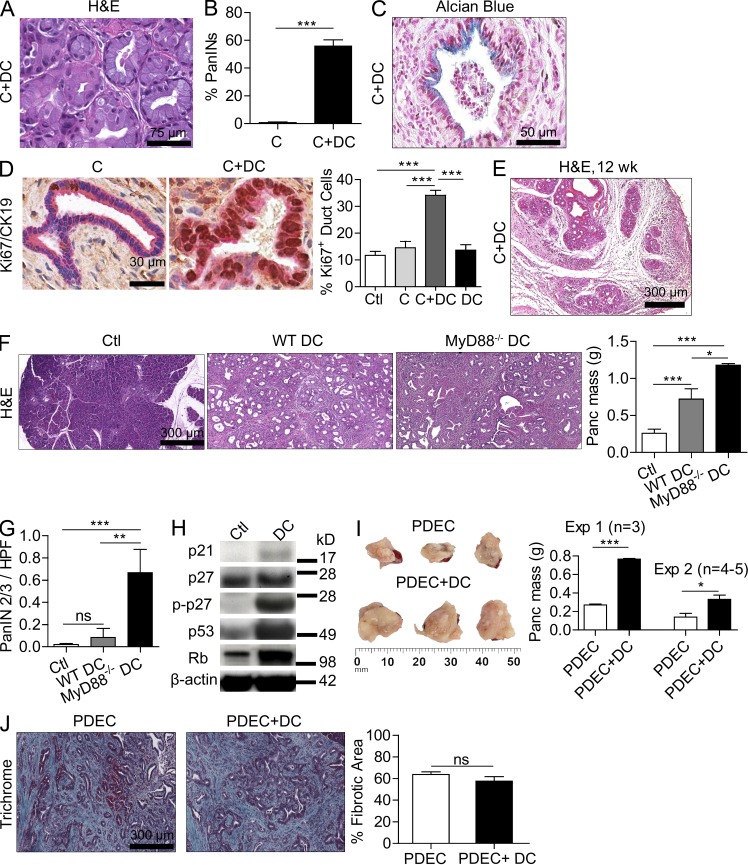
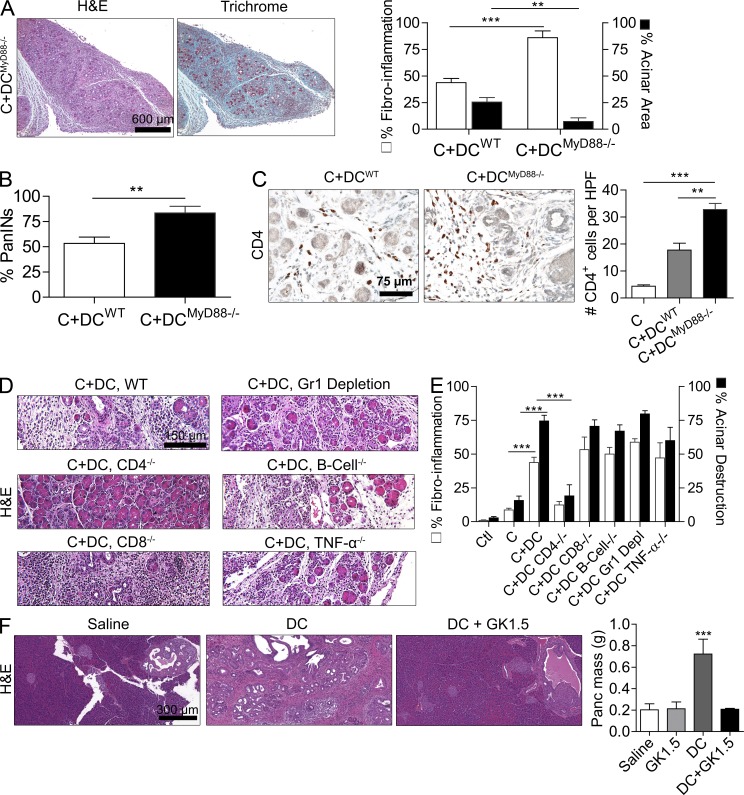
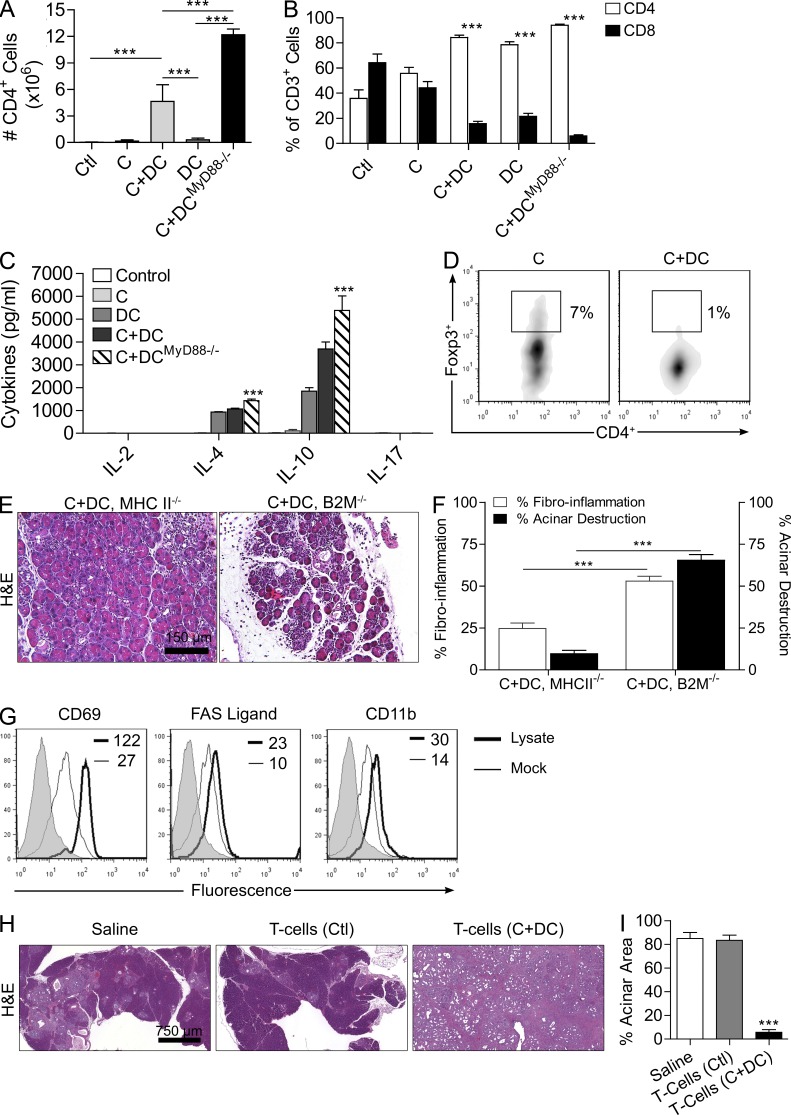
The transition of chronic pancreatic fibroinflammatory disease to neoplasia is a primary example of the paradigm linking inflammation to carcinogenesis. However, the cellular and molecular mediators bridging these entities are not well understood. Because TLR4 ligation can exacerbate pancreatic inflammation, we postulated that TLR4 activation drives pancreatic carcinogenesis. In this study, we show that lipopolysaccharide accelerates pancreatic tumorigenesis, whereas TLR4 inhibition is protective. Furthermore, blockade of the MyD88-independent TRIF pathway is protective against pancreatic cancer, whereas blockade of the MyD88-dependent pathway surprisingly exacerbates pancreatic inflammation and malignant progression. The protumorigenic and fibroinflammatory effects of MyD88 inhibition are mediated by dendritic cells (DCs), which induce pancreatic antigen-restricted Th2-deviated CD4(+) T cells and promote the transition from pancreatitis to carcinoma. Our data implicate a primary role for DCs in pancreatic carcinogenesis and illustrate divergent pathways in which blockade of TLR4 signaling via TRIF is protective against pancreatic cancer and, conversely, MyD88 inhibition exacerbates pancreatic inflammation and neoplastic transformation by augmenting the DC-Th2 axis.


Figures

Figure 1.
Figure 1.
TLR4 signaling modulates pancreatic carcinogenesis. (A–E) 4-wk-old p48Cre;KrasG12D mice were treated with saline or LPS and sacrificed at 4 wk. (A and B) Pancreata were stained with H&E, Trichrome, and CD45 (A) and weighed (B). (C–E) The presence of graded PanIN lesions (C), fibrotic area (D), and leukocytic infiltrate (E) were quantified by examining 10 high-powered fields (HPFs) per pancreas (n = 6 mice/group; ***, P < 0.001). (F and G) 4-wk-old p48Cre;KrasG12D mice were treated with saline, caerulein, or caerulein + TLR4 inhibitor. Representative H&E-stained sections are shown, and the number of dysplastic ducts per HPF was calculated (n = 5 mice/group; ***, P < 0.001). (H) Live pancreatic mononuclear cells from 6-mo-old p48Cre;KrasG12D or WT mice were gated and costained for CD45, CD11c, CD3, F480, B220, Gr1, and TLR4. Median fluorescence for TLR4 is shown for specific cellular subsets. Data are representative of experiments repeated three times. (I) Sections of normal human pancreas (n = 3) and human pancreatic cancer (n = 19) were stained for TLR4. Representative images are shown, and data were quantified (***, P < 0.001). (J) Pancreatic duct fluid was harvested at the time of surgical resection from four patients with pancreatic cancer and two patients with benign endocrine tumors and tested for TLR4 ligand levels on HEK-Blue reporter cells (***, P < 0.001). (K) Pancreatic ductal fluid from two patients with pancreatic carcinoma was harvested at the time of operative duct transection and analyzed for HMGB-1 and S100A9 expression by Western blotting. Error bars indicate standard error of the mean.
Figure 2.
Figure 2.
TLR4 regulation of pancreatic tumorigenesis and pancreatitis is mediated by stromal inflammatory cells and requires TRIF. (A and B) p48Cre;KrasG12D mice were irradiated and made chimeric by bone marrow transfer from WT or TLR4−/− mice. 7 wk later, mice were treated with either saline or two doses of caerulein (C). Three weeks afterward, mice were sacrificed and pancreata were assessed by H&E. The fraction of dysplastic ducts was measured (n = 5/group; ***, P < 0.001). Insets show higher magnification. (C) WT chimeric and TLR4−/− chimeric mice were treated with 5 µg LPS. Serum cytokine levels were measured at 6 h (***, P < 0.001). (D) WT or TLR4−/− mice were adoptively transferred with intrapancreatic KrasG12D PDECs. Pancreata were harvested and weighted at 6 wk (n = 5 mice/group; ***, P < 0.001). (E) Raji cells were stimulated for 90 s with 1 µg/ml LPS in the presence of TRIF inhibitor (Pepinh-TRIF) or control peptide (Pepinh-Ctl). Expression of pIRF3 and β-actin was measured by Western blotting. (F) 4-wk-old p48Cre;KrasG12D mice were treated with saline, caerulein + control peptide, or caerulein + TRIF inhibitor. Representative H&E-stained sections are shown, and the number of dysplastic ducts per HPF was calculated (n = 5 mice/group; ***, P < 0.001). (G) WT or TRIF−/− mice were adoptively transferred with intrapancreatic KrasG12D PDECs. Pancreata were harvested and weighted at 6 wk (n = 4–5 mice/group; ***, P < 0.001). (H) Acute pancreatitis was induced using caerulein in WT or TRIF−/− mice. The fraction of viable acini was calculated (n = 4 mice/group; ***, P < 0.001). (I) 4-wk-old p48Cre;KrasG12D mice were treated with saline or Poly I:C before sacrifice 4 wk later. Representative H&E-stained sections are shown, and the number of PanIN lesions per HPF was quantified (n = 4 mice/group; ***, P < 0.001). Error bars indicate standard error of the mean.
Figure 3.
Figure 3.
MyD88 blockade accelerates malignant transformation and stromal inflammation. (A) Mice were treated with LPS and MyD88 inhibitory peptide (MyD88i) or control peptide. At 6 h, pancreata were assayed for expression of IRAK and p-IRAK. (B–D) p48Cre;KrasG12D mice were treated with caerulein for 2 d to accelerate carcinogenesis before sacrifice 3 wk later. In addition, mice were administered either MyD88 inhibitory peptide or control peptide. (B) Tumor size was recorded. (C and D) Paraffin-embedded pancreatic sections were stained using H&E and Ki67 and using mAbs directed against p53 (C) and CK19 (D) an epithelial cell marker (n = 6 mice/group). (E and F) WT chimeric and MyD88−/− chimeric p48Cre;KrasG12D mice were treated with caerulein and sacrificed at 3 wk. The fraction of metaplastic ducts and PanIN lesions was quantified (n = 4–6 mice/group; ***, P < 0.001). (G) KrasG12D PDECs were cultured with MyD88 inhibitory peptide or control peptide. Cells were pulsed with [3H]thymidine for 20 h, and its incorporation was measured. (H and I) MyD88−/− and WT mice were challenged with caerulein alone or caerulein + TRIF inhibitor or control peptide for 3 wk. Fibroinflammatory changes were quantified (n = 4–6 mice/group; ***, P < 0.001). Error bars indicate standard error of the mean.
Figure 4.
Figure 4.
MyD88 blockade within DCs exacerbates pancreatic disease in a CD4+ T cell–dependent manner. (A) 4-wk-old CD11c-Cre MyD88 Floxed+/+ mice and control animals were treated with caerulein (C) for 3 wk to induce chronic pancreatitis. Pancreata were examined by Trichrome staining, and the fibroinflammatory area was quantified (n = 4 mice/group; ***, P < 0.001). (B) p48Cre;KrasG12D mice were made chimeric using bone marrow derived from WT or CD11c-Cre MyD88 Floxed+/+ mice. Chimeric mice were treated with caerulein and sacrificed at 3 wk (n = 4–5/group). Representative images are shown, and the fraction of graded PanIN lesions was quantified (***, P < 0.001). (C) CD4+ T cells were harvested from the pancreata of p48Cre;KrasG12D mice and caerulein-treated WT mice that were administered MyD88 inhibitory peptide or control peptide. IL-2 and IL-4 levels were measured in cell culture supernatant (***, P < 0.001). (D) 4-wk-old p48Cre;KrasG12D mice were treated with C, C + MyD88 inhibitor, C + GK1.5 to deplete CD4 T cells, C + MyD88 inhibitor + GK1.5, or additional controls. Mice were sacrificed at 3 wk, and the foci of invasive cancer were quantified by examining 10 HPFs per mouse (n = 5 mice/group; ***, P < 0.001). (E) IL-10 was measured in cell culture supernatant from purified pancreatic CD4+ T cells from mice treated for 2 d with saline, VAG539, caerulein, or caerulein + VAG539 (***, P < 0.001). (F) WT mice were treated with caerulein alone or caerulein + VAG539 for 3 wk. Representative H&E-stained sections are shown (n = 4 mice/group), and fibroinflammatory changes were quantified (***, P < 0.001). Error bars indicate standard error of the mean.
Figure 5.
Figure 5.
DCs expand in pancreatic carcinoma and chronic pancreatitis. (A) Pancreata from p48Cre;KrasG12D and WT mice were examined by immunofluorescence using anti-CD11c. (B and C) In addition, the fraction of both CD45+ and CD11c+ leukocytes (B) and the total number of DCs (C) in pancreata of 9-mo-old p48-Cre;KrasG12D and WT mice were determined by flow cytometry (**, P < 0.01). (D and E) DCs from the pancreata of WT and p48-Cre;KrasG12D mice were further examined for B220 (D) and additional surface marker expression (E). Median fluorescence is shown below respective histograms. Experiments are representative of those repeated more than three times using a mean of three mice per group. (F) Frozen sections of human pancreatic cancer specimens were examined by immunofluorescence (CD123) and immunohistochemistry (DC-SIGN and CD1a). Insets show higher magnification. (G) The fraction of DCs among all CD45+ leukocytes in both the pancreas and the spleen was measured at timed intervals during the 3-wk course of caerulein administration in WT mice (mean of four mice per data point). (H) The total number of DCs per pancreas was measured on day 21 of saline or caerulein administration in WT mice (**, P < 0.01). Error bars indicate standard error of the mean.
Figure 6.
Figure 6.
DCs exacerbate pancreatic fibroinflammation. WT mice were treated with saline, C alone, DCs alone, or C+DCs. (A–C) Paraffin-embedded sections of pancreata were stained with H&E (A) and Picric acid–Sirius red (B), and the fibroinflammatory area per mouse pancreas was calculated for all treatment groups (C). Insets show higher magnification. (D–G) Pancreata were also stained using mAbs directed against amylase (D and E) and insulin (F), and serum glucose (G) levels were calculated. (H–L) Similarly, pancreata were stained using mAbs directed against desmin (H and I), α-SMA (J and K), and CD3 (L). (M) Using flow cytometry, the relative number of intrapancreatic B cells, macrophages, neutrophils, and NK cells in chronic pancreatitis in the context of exogenous DCs expansion was calculated (n = 8–10 mice/group; *, P < 0.05; ***, P < 0.001). Error bars indicate standard error of the mean.
Figure 7.
Figure 7.
Flt3L treatment exacerbates pancreatitis. (A) The time course of DC expansion in the pancreas of Flt3L-treated WT mice is shown. Both the total number of pancreatic DCs and their fraction among pancreatic leukocytes are indicated. Data are based on a mean of four mice per time point. (B) The fraction of inflammatory monocytes in the pancreata of Flt3L-treated mice and controls was calculated. Day 15 data are shown. (C and D) Mice treated with Flt3L alone, caerulein alone, or caerulein + Flt3L were stained with H&E, Gomori’s Trichrome, and anti-CD45. (D) Fibroinflammatory area was quantified by examining 10 HPFs per mouse (five mice per group; ***, P < 0.001). Error bars indicate standard error of the mean.
Figure 8.
Figure 8.
DCs promote the transition from chronic pancreatitis to ductal dysplasia and accelerate the growth rate of pancreatic tumors. (A and B) 4-wk-old WT mice were treated with C or C+DCs for 3 wk. Representative H&E-stained section from C+DC-treated pancreata is shown. The fraction of pancreatic ducts in C or C+DC mice exhibiting PanIN lesions was quantified by examining pancreata from >15 mice per group. (C) Representative paraffin-embedded section of pancreata from mice treated with C+DCs and stained with Alcian blue is shown. (D) Pancreata from mice treated with C or C+DCs were stained for CK19 (pink) and Ki67 (brown), and the fraction of Ki67+ ductal cells was quantified for each treatment group. (E) Representative H&E-stained image of pancreas from a mouse treated for 12 wk with C+DCs. (F and G) 4-wk-old p48Cre;KrasG12D mice were adoptively transferred with DCs derived from WT or MyD88−/− mice thrice weekly for 5 wk before sacrifice (n = 5/group). Representative H&E-stained sections are shown, pancreata were weighed, and the fraction of PanIN 2/3 ducts per HPF was determined (G). (H) Lysate from pancreata of mice adoptively transferred with WT DCs or saline was tested for expression of p21, p27, p-p27, p53, and Rb by Western blotting. (I) Mice were challenged with 3 × 10⁶ (experiment 1) or 106 (experiment 2) KRasG12D PDECs. In each experiment, selected mice were adoptively transferred with DCs (106) thrice weekly from weeks 2–6. Mice were sacrificed after 6 wk, and pancreatic lesions were weighed. (J) Representative Trichrome-stained paraffin-embedded sections are shown, and the fraction of fibrotic pancreatic area was quantified (*, P < 0.05; **, P < 0.01; ***, P < 0.001). Error bars indicate standard error of the mean.
Figure 9.
Figure 9.
Fibroinflammatory and dysplastic effects of DCs are exaggerated upon MyD88 inhibition and are contingent on CD4+ T cells. (A–C) MyD88−/− or WT DCs were adoptively transferred to WT mice undergoing caerulein-induced chronic pancreatitis. The extent of fibrosis and acinar destruction (A), as well as PanIN formation (B) and size of the CD4+ T cell infiltrate (C) in pancreata of treated animals were determined. Experiments were performed using a mean of five mice per group (**, P < 0.01; ***, P < 0.001). (D and E) Mice deficient in CD4+ T cells, CD8+ T cells, B cells, Gr1+ inflammatory monocytes and neutrophils, or TNF production were induced to develop chronic pancreatitis in the context of DC overexpansion. Pancreatic effacement and fibroinflammatory changes were quantified for each group by examining 10 HPFs per slide (n = 4–6 mice/experimental group; ***, P < 0.001). (F) 4-wk-old p48Cre;KrasG12D mice were adoptively transferred with DCs or administered saline for 5 wk. Selected cohorts were additionally treated with GK1.5 to deplete CD4+ T cells. Pancreas weights were measured (n = 4 mice/experimental group; ***, P < 0.001). Error bars indicate standard error of the mean.
Figure 10.
Figure 10.
DCs exacerbate pancreatic disease by inducing antigen-restricted Th2 cells. (A and B) The total number of CD4+ cells in the pancreata of mice treated with C+DCWT, C+DCMyD88−/−, and controls (A) and the fraction of intrapancreatic CD4+ or CD8+ T cells among all CD3+ cells (B) were measured by flow cytometry (***, P < 0.001). (C) CD4+ T cell differentiation in the pancreas of mice treated with C+DCWT, C+DCMyD88−/−, and controls was determined by measuring their production of Th1, Th2, and Th17 cytokines after FACS sorting. (D) The fraction of intrapancreatic Treg cells was determined by gating on CD45+CD25+ leukocytes and cross staining for CD4 and Foxp3. In vitro assays were repeated three times with similar results. (E and F) MHC II−/− and β2-microglobulin−/− mice treated with caerulein were recipients of DC transfer. A mean of four mice per group was used in these experiments (***, P < 0.001). (G) To determine the pancreatic antigen specificity of effector T cells, FACS-sorted pancreas-infiltrating CD4+ T cells from WT C+DC-treated mice were cultured with pancreatic lysate– or mock-pulsed DCs. CD4+ T cell activation was then determined by their expression of CD69, FAS ligand, and CD11b. Gray histograms represent isotype control. Median fluorescent indexes are shown for each group. Experiments were repeated three times with similar results. (H and I) p48Cre;KrasG12D mice were adoptively transferred for 5 wk with CD4+ T cells derived from control and C+DC-treated mice (n = 3/group). Representative H&E-stained sections and images of pancreata are shown (H), and the fraction of pancreatic area with preserved acinar architecture was measured (I; ***, P < 0.001). Error bars indicate standard error of the mean.

Comment in

Similar articles

Cited by

References

    1. Agbunag C., Lee K.E., Buontempo S., Bar-Sagi D. 2006. Pancreatic duct epithelial cell isolation and cultivation in two-dimensional and three-dimensional culture systems. Methods Enzymol. 407:703–710 10.1016/S0076-6879(05)07055-2 - DOI - PubMed
    1. Ahn J., Chen C.Y., Hayes R.B. 2012. Oral microbiome and oral and gastrointestinal cancer risk. Cancer Causes Control. 23:399–404 10.1007/s10552-011-9892-7 - DOI - PMC - PubMed
    1. Ammann R.W., Akovbiantz A., Largiader F., Schueler G. 1984. Course and outcome of chronic pancreatitis. Longitudinal study of a mixed medical-surgical series of 245 patients. Gastroenterology. 86:820–828 - PubMed
    1. Bantsimba-Malanda C., Marchal-Sommé J., Goven D., Freynet O., Michel L., Crestani B., Soler P. 2010. A role for dendritic cells in bleomycin-induced pulmonary fibrosis in mice? Am. J. Respir. Crit. Care Med. 182:385–395 10.1164/rccm.200907-1164OC - DOI - PubMed
    1. Barrat F.J., Coffman R.L. 2008. Development of TLR inhibitors for the treatment of autoimmune diseases. Immunol. Rev. 223:271–283 10.1111/j.1600-065X.2008.00630.x - DOI - PubMed

Publication types

MeSH terms

Substances