. 2012 Aug 27;209(9):1689-702.
doi: 10.1084/jem.20101355. Epub 2012 Aug 20.

IL-1R-MyD88 signaling in keratinocyte transformation and carcinogenesis

Affiliations

IL-1R-MyD88 signaling in keratinocyte transformation and carcinogenesis

Christophe Cataisson et al. J Exp Med. .

Abstract

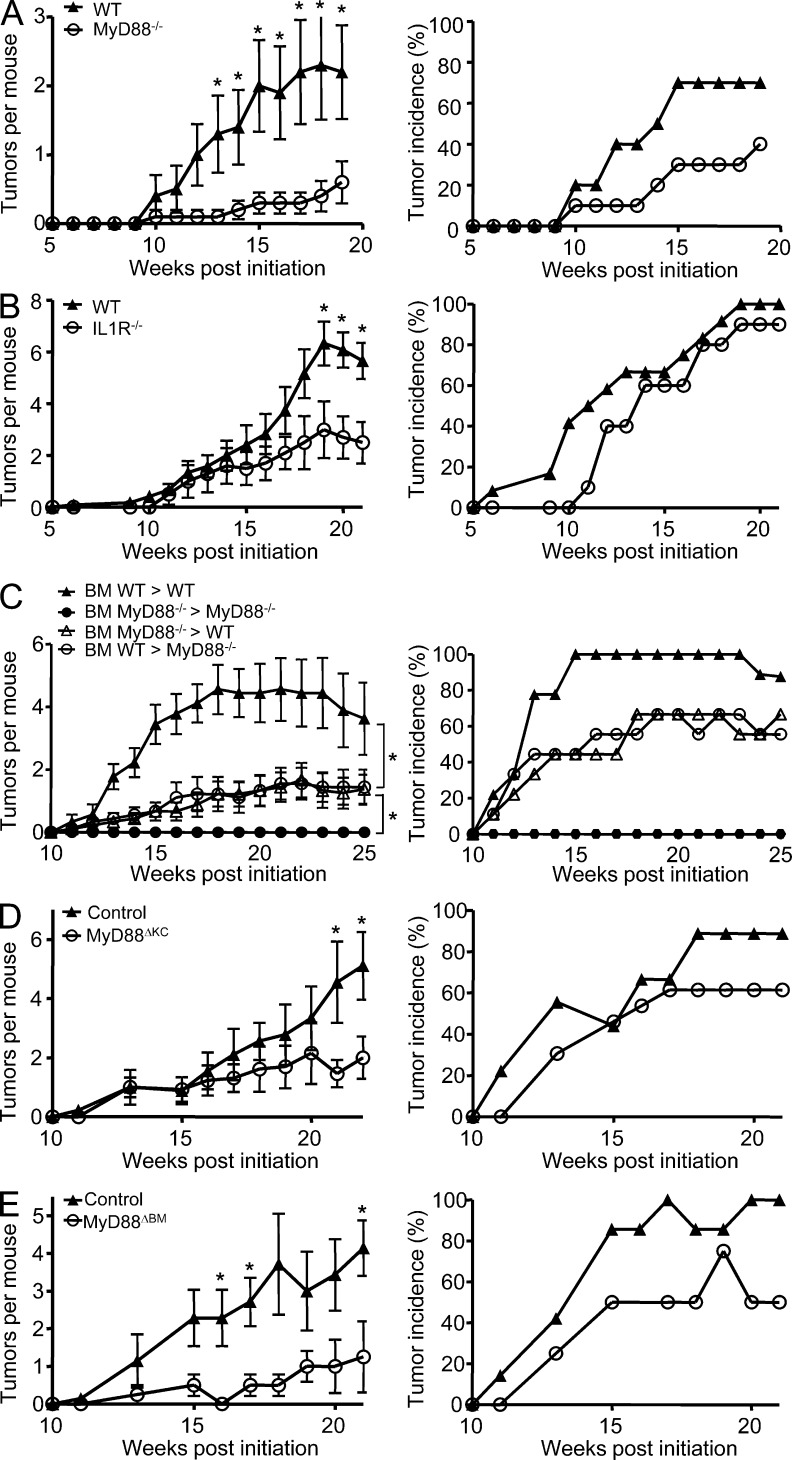
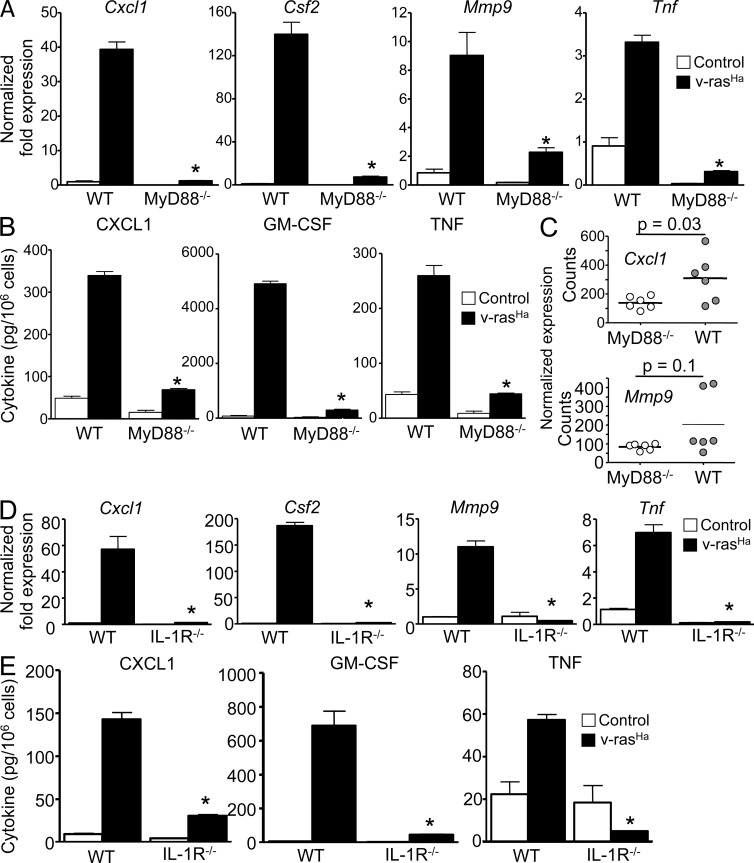
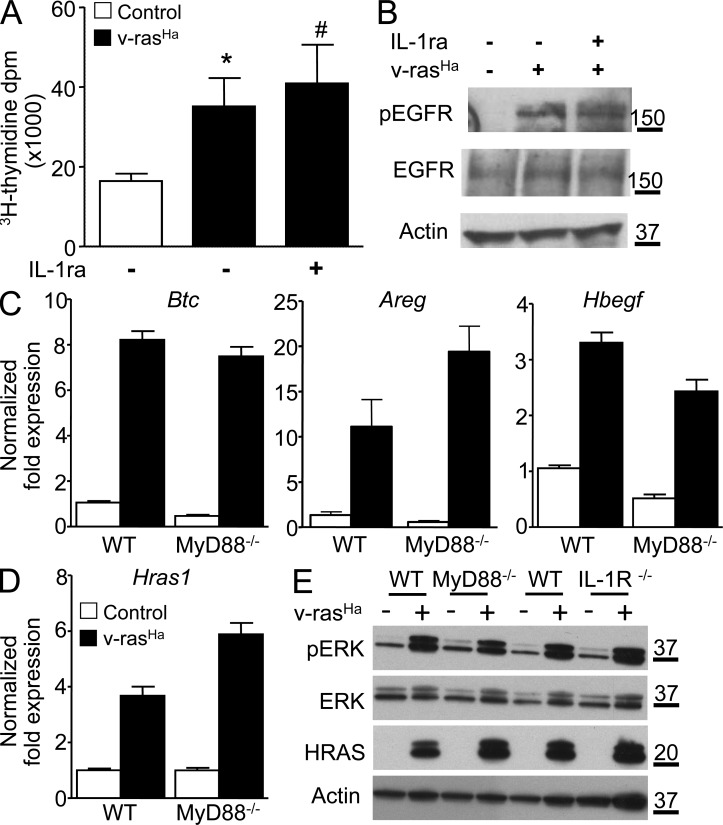
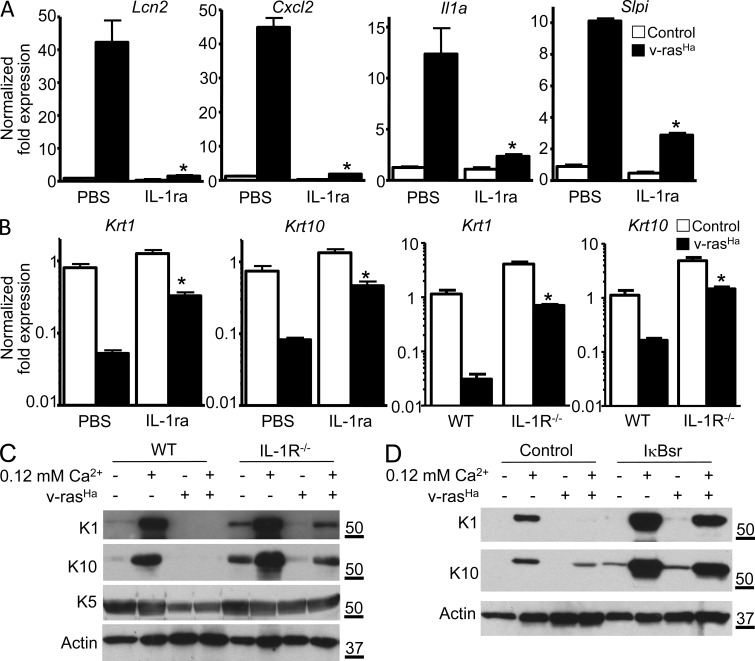
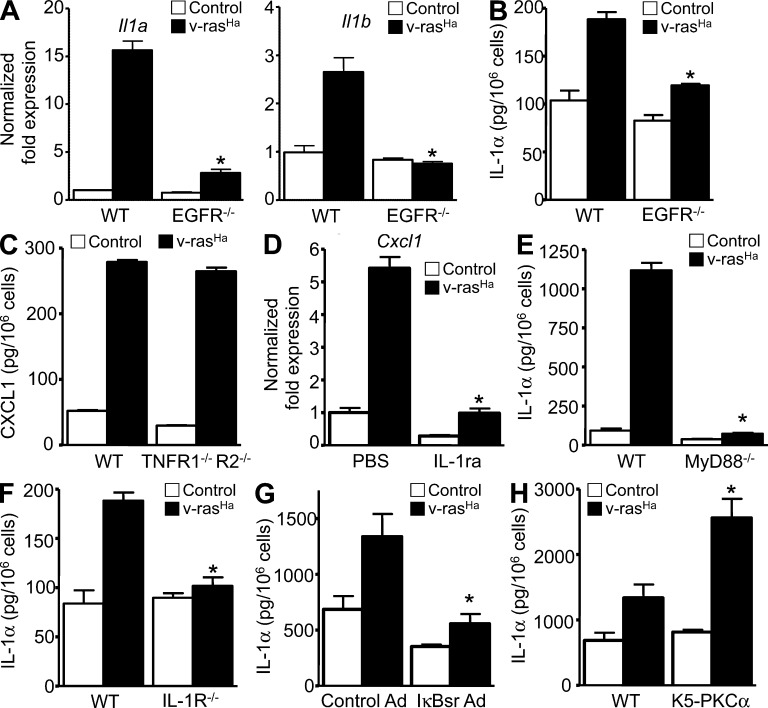
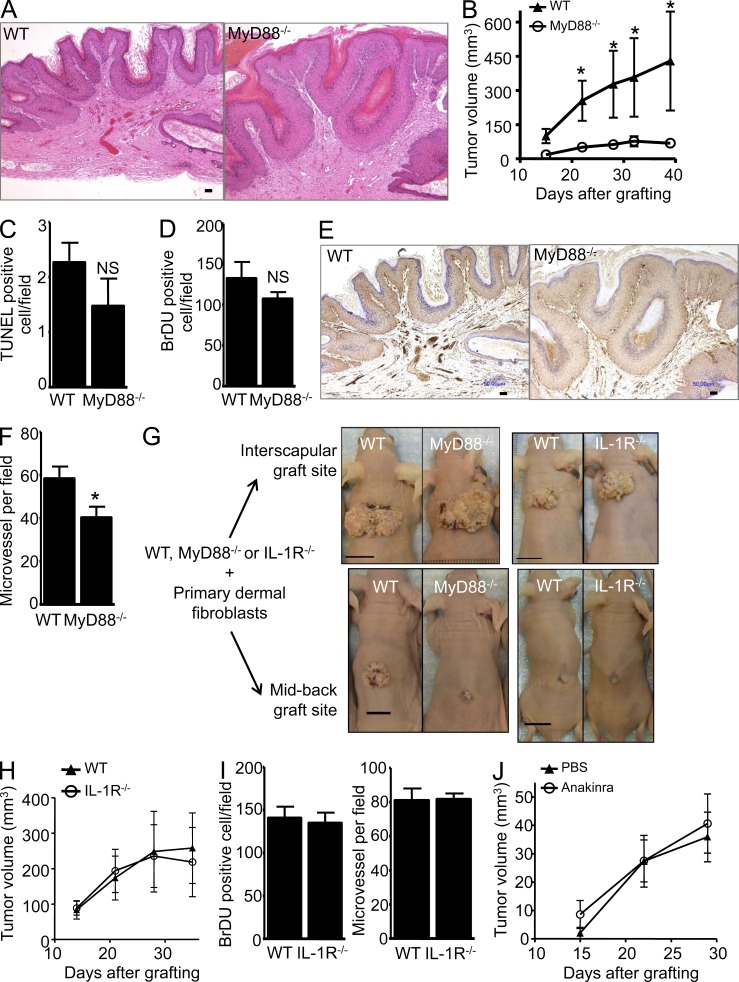
Constitutively active RAS plays a central role in the development of human cancer and is sufficient to induce tumors in two-stage skin carcinogenesis. RAS-mediated tumor formation is commonly associated with up-regulation of cytokines and chemokines that mediate an inflammatory response considered relevant to oncogenesis. In this study, we report that mice lacking IL-1R or MyD88 are less sensitive to topical skin carcinogenesis than their respective wild-type (WT) controls. MyD88(-/-) or IL-1R(-/-) keratinocytes expressing oncogenic RAS are hyperproliferative and fail to up-regulate proinflammatory genes or down-regulate differentiation markers characteristic of RAS-expressing WT keratinocytes. Although RAS-expressing MyD88(-/-) keratinocytes form only a few small tumors in orthotopic grafts, IL-1R-deficient RAS-expressing keratinocytes retain the ability to form tumors in orthotopic grafts. Using both genetic and pharmacological approaches, we find that the differentiation and proinflammatory effects of oncogenic RAS in keratinocytes require the establishment of an autocrine loop through IL-1α, IL-1R, and MyD88 leading to phosphorylation of IκBα and NF-κB activation. Blocking IL-1α-mediated NF-κB activation in RAS-expressing WT keratinocytes reverses the differentiation defect and inhibits proinflammatory gene expression. Collectively, these results demonstrate that MyD88 exerts a cell-intrinsic function in RAS-mediated transformation of keratinocytes.


Figures

Figure 1.
Figure 1.
Responsiveness of MyD88−/−, IL-1R−/−, MyD88−/− BM chimeric, tissue-targeted MyD88-deficient mice, and their respective controls to chemically induced skin carcinogenesis. (A–E) Left panels represent the mean number of skin tumors per mouse (mean ± SEM). Right panels represent the percentage of mice with skin tumors. Mice were treated with DMBA/0.2 ml acetone at time 0 then with 10 nmol TPA/0.2 ml acetone three times a week for up to 20 wk. Papilloma development was monitored during the course of the experiment. (A) WT (n = 10) and MyD88−/− (n = 10). (B) WT (n = 12) and IL-1R−/− (n = 10). (C) Mice were lethally irradiated and 2 h later injected i.v. with 20 × 106 BM cells. 8 wk later, BM WT > WT (n = 9), BM MyD88−/− > MyD88−/− (n = 5), BM MyD88−/− > WT (n = 9), and BM WT > MyD88−/− (n = 9) groups were treated as in A, and papilloma development was followed during 25 wk. (D) MyD88ΔKC (n = 13) and control littermates (n = 9). (E) MyD88ΔBM (n = 4) and control littermates (n = 7). Data shown in A, B, and E are representative of three independent experiments, whereas data shown in C and D are representative of two independent experiments. Significant differences in the number of papillomas that develop at each time point were found by Student’s t test (*, P < 0.05). In C, comparisons of BM WT > WT and BM MyD88−/− > WT (*, P < 0.05) and BM MyD88−/− > MyD88−/− and BM WT >MyD88−/− (*, P < 0.05) were analyzed by Mann-Whitney U test.
Figure 2.
Figure 2.
Expression of NF-κB–regulated proinflammatory factors in RAS-transformed keratinocytes requires a functional IL-1–MyD88 axis. (A and D) Real-time PCR analyses 3 d after RAS transduction of Cxcl1, Csf2, Mmp9, and Tnf mRNA expression in control and v-rasHa–transduced keratinocytes (WT and MyD88−/− [A] or IL-1R−/− [D]). (B and E) CXCL1, GM-CSF, and TNF concentrations were determined by ELISA in culture supernatants from control and v-rasHa–transduced keratinocytes (WT and MyD88−/− [B] or IL-1R−/− [E]) 3 d after RAS transduction. Data shown are representative of three independent experiments, and bars represent the mean ± SEM of five replicates. *, P < 0.05 between v-rasHa WT and v-rasHa gene–deficient strain. (C) NanoString analysis of Cxcl1 and Mmp9 mRNA expression in laser capture–microdissected WT and MyD88−/− papillomas from chemically induced skin carcinogenesis. The y axis shows normalized NanoString counts. Each circle represents an independent squamous papilloma. Horizontal bars indicate the mean.
Figure 3.
Figure 3.
IL-1α autocrine signaling contributes to oncogenic RAS-mediated activation of NF-κB–regulated genes. (A) Real-time PCR analysis of Cxcl1, Csf2, Mmp9, and Tnf mRNA expression in control keratinocytes or keratinocytes transduced for 3 d with v-rasHa and infected with A-CMV (control) or degradation-resistant IκBα (IκBsr) adenovirus to block NF-κB activity for an additional 2 d. *, P < 0.05 between v-rasHa control adenovirus and v-rasHa IκBsr adenovirus. (B) Real-time PCR analysis of Cxcl1, Csf2, Mmp9, and Tnf mRNA expression in control or v-rasHa–transduced WT keratinocytes treated with PBS or IL-1R antagonist (IL-1ra, Anakinra). *, P < 0.05 between v-rasHa PBS and v-rasHa IL-1ra. (A and B) Data shown are representative of three independent experiments, and bars represent the mean ± SEM of three replicates. (C) Real-time PCR analysis of Cxcl1 and Csf2 mRNA expression in control and v-rasHa–transduced keratinocytes treated with control IgG, IL-1α neutralizing antibodies, or IL-1β neutralizing antibodies. Data shown are representative of two independent experiments, and bars represent the mean ± SEM of three replicates. *, P < 0.05 between v-rasHa + IgG and v-rasHa + anti–IL-1α. (D) Nuclear extracts (top) or total cell extract (bottom) from primary keratinocytes transduced for 3 d with v-rasHa in the presence or absence of IL-1ra (Anakinra) were analyzed by Western blotting. The picture is representative of three independent experiments. Molecular mass is indicated in kilodaltons.
Figure 4.
Figure 4.
The EGFR autocrine loop is intact in RAS-transformed MyD88-deficient keratinocytes. (A) Tritiated thymidine incorporation was measured in control and v-rasHa–transduced WT keratinocyte cultures treated with IL-1ra for 3 d. Data shown are representative of three independent experiments, and bars represent the mean ± SEM value of four replicates. *, P < 0.05 between v-rasHa and control; #, no significant difference between v-rasHa − IL-1ra and v-rasHa + IL-1ra. (B) Total cell extract from primary keratinocytes transduced for 3 d with v-rasHa in the presence or absence of IL-1ra (Anakinra) was analyzed by Western blotting for phospho-EGFR (Tyr1068), total EGFR, and actin as loading control. The picture is representative of three independent experiments. (C) Real-time PCR analysis of Btc (betacellulin), Areg (amphiregulin), and Hbegf (heparin-binding EGF-like growth factor) in control and v-rasHa–transduced keratinocytes (WT and MyD88−/−) 3 d after RAS transduction. (D) Real-time PCR analysis of Hras1 (H-ras) in control and v-rasHa–transduced WT and MyD88−/− keratinocytes. (C and D) Data shown are representative of three independent experiments, and bars represent the mean ± SEM of three replicates. (E) Total cell extract from MyD88−/− and IL-1R−/− primary keratinocytes and their respective controls transduced for 3 d with v-rasHa were analyzed by Western blotting for phospho-ERK, total ERK, H-ras, and actin as loading control. The picture is representative of two independent experiments. (B and E) Molecular mass is indicated in kilodaltons.
Figure 5.
Figure 5.
IL-1α–mediated activation of NF-κB is responsible for the altered expression of differentiation markers in RAS-transformed keratinocytes. (A) Real-time PCR analysis of Lcn2, Cxcl2, Il1a, and Slpi mRNA expression in control or v-rasHa–transduced WT keratinocytes treated with PBS or IL-1ra (Anakinra). *, P < 0.05 between v-rasHa PBS and v-rasHa IL-1ra. (B) Real-time PCR analysis of Krt1 (keratin 1) and Krt10 (keratin 10) mRNA expression in control and v-rasHa–transduced keratinocytes (PBS or IL-1ra treated or IL-1R WT and IL-1R−/−) 3 d after RAS transduction. *, P < 0.05 between v-rasHa PBS and v-rasHa IL-1ra or v-rasHa IL-1R WT and v-rasHa IL-1R−/−. (A and B) Data shown are representative of three independent experiments, and bars represent the mean ± SEM of three replicates. (C and D) Total SDS cell extracts from control and v-rasHa–transduced keratinocytes (IL-1R WT and IL-1R−/−; C) or WT keratinocytes infected with A-CMV (control) or degradation-resistant IκBα super repressor (IκBsr) adenovirus to block NF-κB activity (D) were analyzed through immunoblotting with specific antibodies for the expression of basal (K5) and early markers of differentiation (K1 and K10). SDS lysates were analyzed from 3-d posttransduction cultures that were maintained in 0.05 or 0.12 mM Ca2+ media for an extra 24 h. Data are representative of three independent experiments. Molecular mass is indicated in kilodaltons.
Figure 6.
Figure 6.
Oncogenic RAS-mediated EGFR–IL-1R signaling loops. (A) Real-time PCR analysis of IL-1α (Il1a) and IL-1β (Il1b) mRNA expression in control or v-rasHa–transduced WT and EGFR−/− keratinocytes. (B) Culture supernatants from WT or EGFR−/− primary keratinocytes were collected after control or v-rasHa transduction. IL-1α concentrations were determined by ELISA. *, P < 0.05 between v-rasHa EGFR WT and v-rasHa EGFR−/−. (C) Culture supernatants from WT and TNFR1−/−/TNFR2−/− primary keratinocytes were collected after control or v-rasHa transduction. CXCL1 concentrations were determined by ELISA. (D) Real-time PCR analysis of CXCL1 (Cxcl1) mRNA expression in keratinocytes pretreated with PBS or IL-1ra (Anakinra) for 1 h before TGF-α stimulation for an extra hour. *, P < 0.05 between TGF-α treatment − IL-1ra and TGF-α treatment + IL-1ra. (E and F) Culture supernatants from WT or MyD88−/− primary keratinocytes were collected after control or v-rasHa transduction. IL-1α concentrations were determined by ELISA in culture supernatants from control and v-rasHa–transduced keratinocytes (WT and MyD88−/− [E] or IL-1R−/− [F]) 3 d after v-rasHa transduction. *, P < 0.05 between v-rasHa WT and v-rasHa gene–deficient strain. (G) Culture supernatant collected from control or v-rasHa–transduced keratinocytes infected with A-CMV (control Ad) or degradation-resistant IκBα (IκBsr Ad) adenovirus to block NF-κB activity. IL-1α concentrations were determined by ELISA. *, P < 0.05 between v-rasHa control Ad and v-rasHa IκBsr Ad. (H) Culture supernatants from WT or primary keratinocytes from mice overexpressing PKC-α (K5-PKCα) were collected after control or v-rasHa transduction. IL-1α concentrations were determined by ELISA. *, P < 0.05 between v-rasHa WT and v-rasHa K5-PKCα. Data shown are representative of two (C and H) to three (A, B, and D–G) independent experiments, and bars represent the mean ± SEM of three (A, B, and D–H) to five (C) replicates.
Figure 7.
Figure 7.
MyD88 deficiency impairs growth of v-rasHa–induced squamous tumors through an IL-1–independent signal. (A and B) Representative H&E micrograph of WT and MyD88−/− orthotopic grafts. WT or MyD88−/− primary v-rasHa–transduced keratinocytes combined with MyD88 WT dermal fibroblasts were grafted onto nude mice (A), and mean tumor volume was calculated as described in Materials and methods (B). Data shown are representative of two independent experiments and are reported as mean ± SEM. *, P < 0.05 between the WT and MyD88−/− group. Each group contains eight to nine mice. Only mice bearing tumors were included in this figure. (C) Tumors from A were stained for markers associated with tumor growth. Apoptotic cells were identified using the ApopTag kit, which stains nuclei containing nicked DNA. Positive nuclei were counted in five to seven randomly selected regions. (D) BrdU-labeled nuclei were detected in stained sections of tumors from mice injected with BrdU 1 h before sacrifice and similarly counted. (C and D) Data are reported as mean ± SEM. NS, difference not statistically significant between the WT and MyD88−/− groups. (E) Immunostaining for CD31 antigen outlining blood vessels within tumors originating from WT or MyD88−/− v-rasHa–transduced keratinocytes. (F) Microvessel density was determined based on the number of CD31+ cells in at least five fields per tumor originating from MyD88 WT or MyD88−/− v-rasHa–transduced keratinocytes. Data are reported as mean ± SEM. *, P < 0.05 between the WT and MyD88−/− groups. (G) Representative photographs of orthotopic grafts at the interscapular site (top) and midback site (bottom). 4 million RAS-keratinocytes were mixed with 5 million SENCAR mouse primary dermal fibroblasts before grafting. WT RAS-keratinocytes from C57BL/6J mice (IL-1R colony) underperform compared with WT RAS-keratinocytes from C57BL/6NCr mice (MyD88 colony) for both graft sites. In addition, the percentage of success of RAS-keratinocyte grafts from C57BL/6J mice at the midback graft site was very poor. WT and MyD88−/− and IL-1R−/− keratinocytes were derived from littermate pups. Grafting data presented in B, H, and J were performed at the midback site. Bars: (A and E) 50 µm; (G) 10 mm. (H) IL-1R WT or IL-1R−/− primary v-rasHa–transduced keratinocytes combined with SENCAR WT dermal fibroblasts were grafted onto nude mice, and mean tumor volume was calculated as described in Materials and methods. Each group contains three to five mice. Data shown are representative of two independent experiments and are reported as mean ± SEM. (I) BrdU-labeled nuclei and immunostaining for CD31 were analyzed as described for D and F. (J) v-rasHa–transduced keratinocytes (PBS or IL-1ra [Anakinra] treated) combined with SENCAR MyD88 WT dermal fibroblasts were grafted onto nude mice, and mean tumor volume was calculated as described in Materials and methods. PBS or Anakinra was administered daily by intraperitoneal injection starting the day after the surgical procedure for the duration of the experiment. Each group contains four to five mice. Data shown are representative of two independent experiments and are reported as mean ± SEM.

Comment in

References

    1. Abel E.L., Angel J.M., Kiguchi K., DiGiovanni J. 2009. Multi-stage chemical carcinogenesis in mouse skin: fundamentals and applications. Nat. Protoc. 4:1350–1362 10.1038/nprot.2009.120 - DOI - PMC - PubMed
    1. Apte R.N., Dotan S., Elkabets M., White M.R., Reich E., Carmi Y., Song X., Dvozkin T., Krelin Y., Voronov E. 2006. The involvement of IL-1 in tumorigenesis, tumor invasiveness, metastasis and tumor-host interactions. Cancer Metastasis Rev. 25:387–408 10.1007/s10555-006-9004-4 - DOI - PubMed
    1. Arwert E.N., Lal R., Quist S., Rosewell I., van Rooijen N., Watt F.M. 2010. Tumor formation initiated by nondividing epidermal cells via an inflammatory infiltrate. Proc. Natl. Acad. Sci. USA. 107:19903–19908 10.1073/pnas.1007404107 - DOI - PMC - PubMed
    1. Bar D., Apte R.N., Voronov E., Dinarello C.A., Cohen S. 2004. A continuous delivery system of IL-1 receptor antagonist reduces angiogenesis and inhibits tumor development. FASEB J. 18:161–163 - PubMed
    1. Blumberg H., Dinh H., Trueblood E.S., Pretorius J., Kugler D., Weng N., Kanaly S.T., Towne J.E., Willis C.R., Kuechle M.K., et al. 2007. Opposing activities of two novel members of the IL-1 ligand family regulate skin inflammation. J. Exp. Med. 204:2603–2614 10.1084/jem.20070157 - DOI - PMC - PubMed

Publication types

MeSH terms

Associated data