

Personal receptor repertoires: olfaction as a model
- PMID: 22908908
- PMCID: PMC3462693
- DOI: 10.1186/1471-2164-13-414
Personal receptor repertoires: olfaction as a model
Abstract
Background: Information on nucleotide diversity along completely sequenced human genomes has increased tremendously over the last few years. This makes it possible to reassess the diversity status of distinct receptor proteins in different human individuals. To this end, we focused on the complete inventory of human olfactory receptor coding regions as a model for personal receptor repertoires.
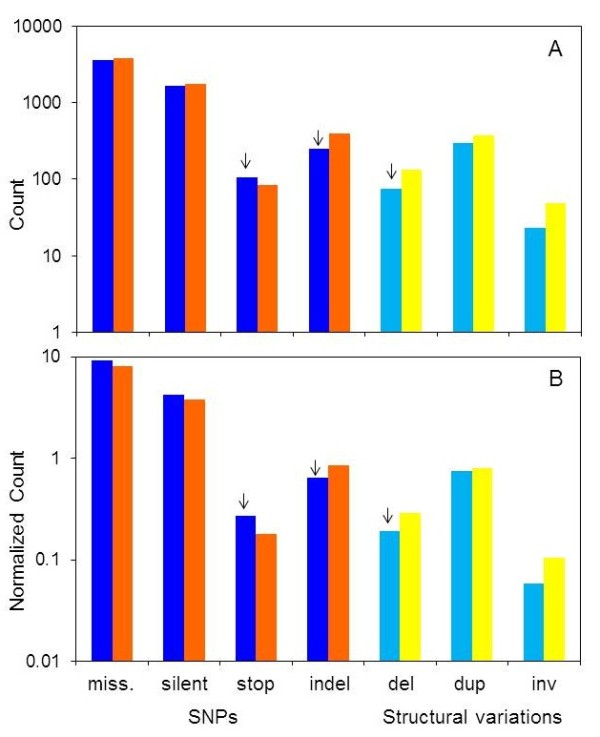
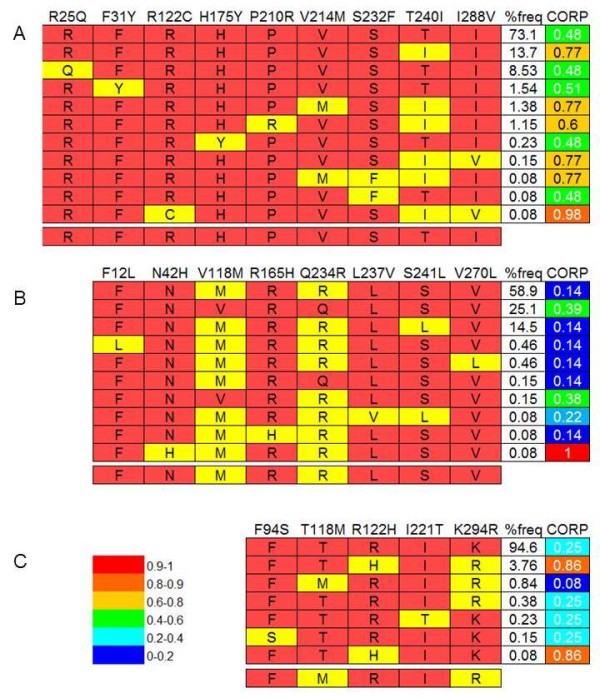
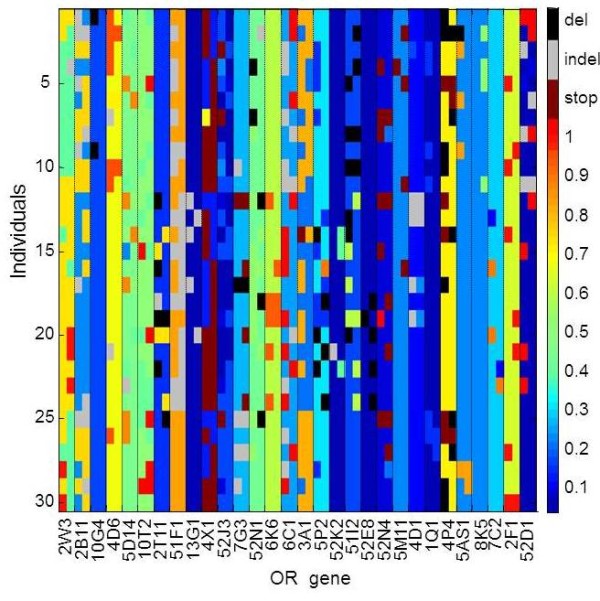
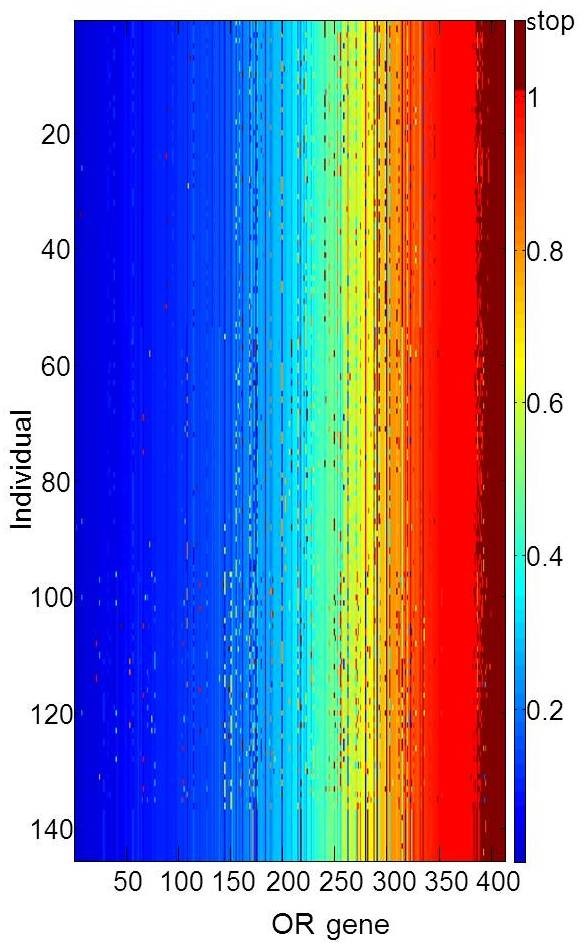
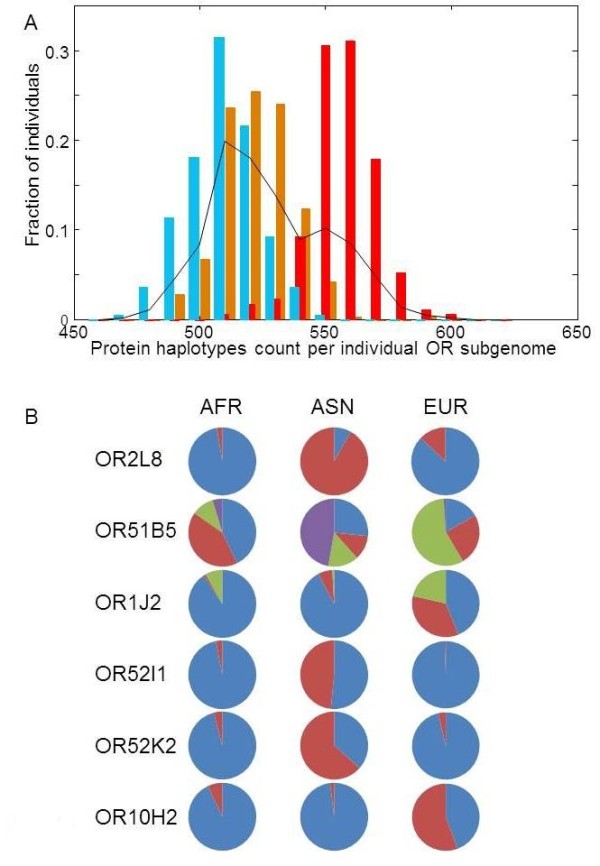
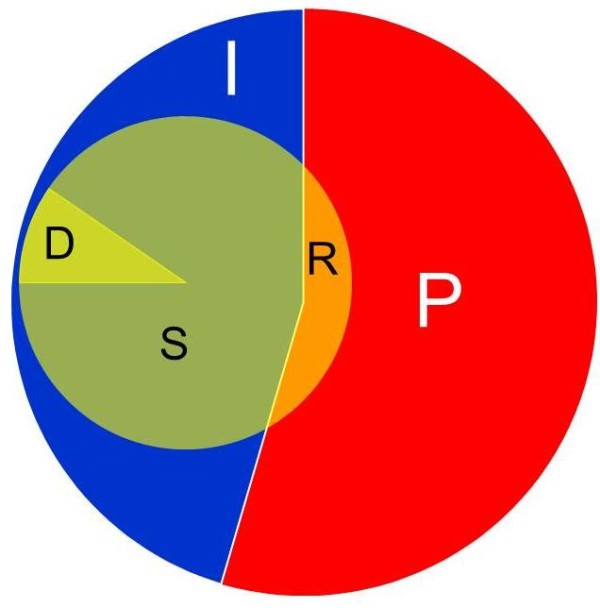
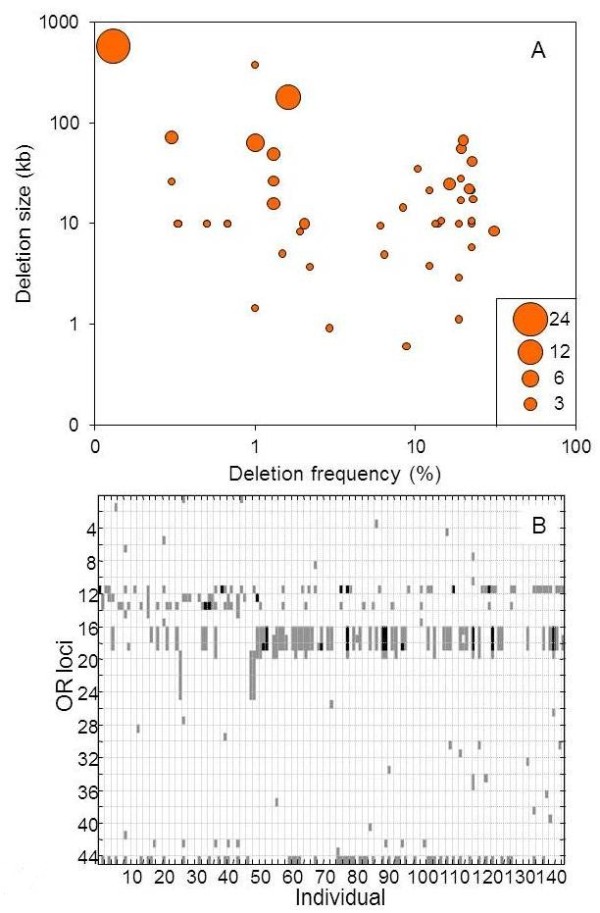
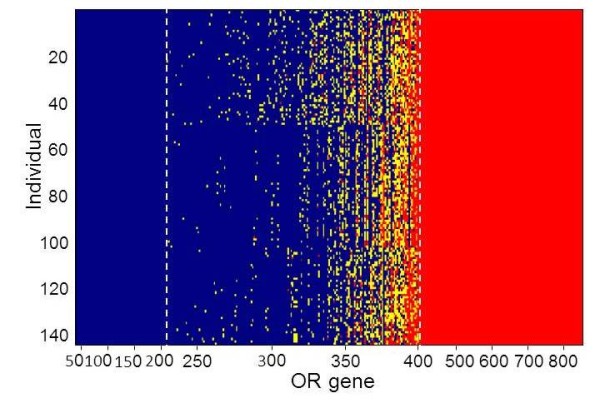
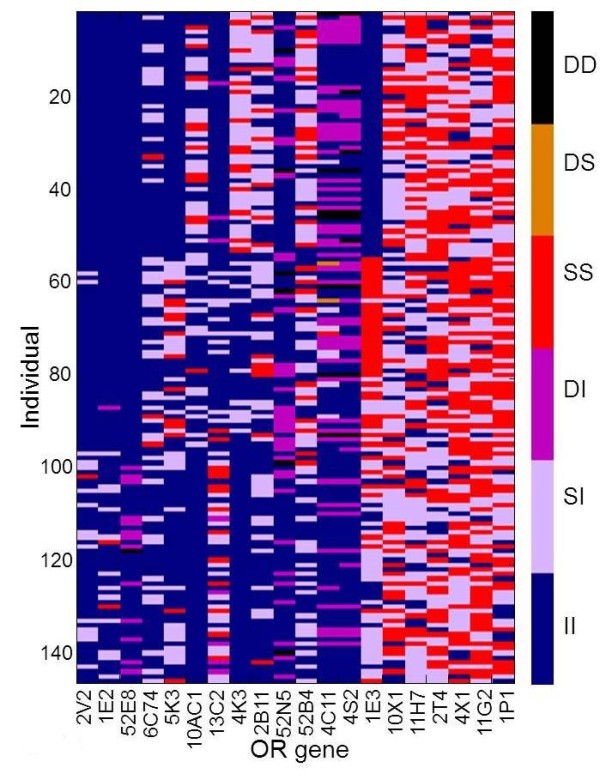
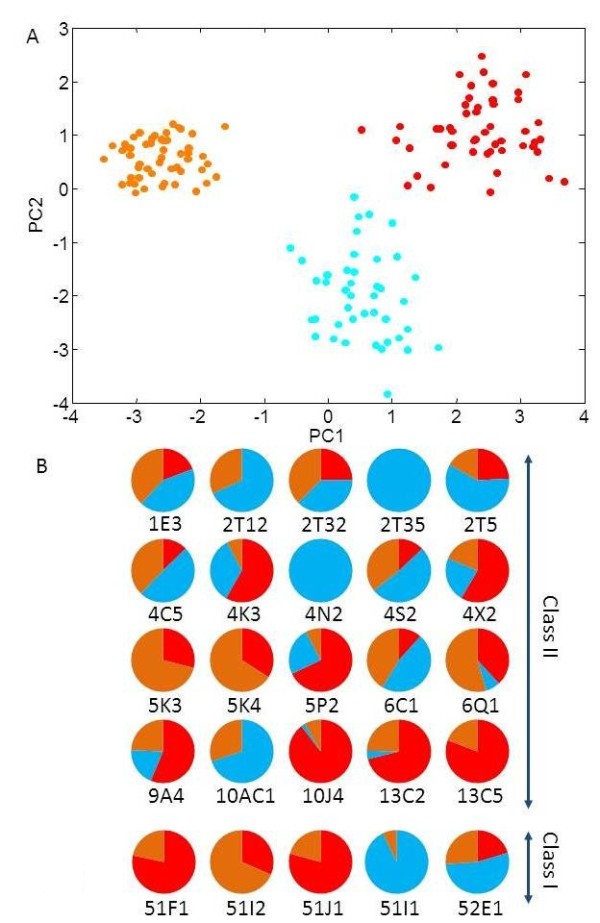
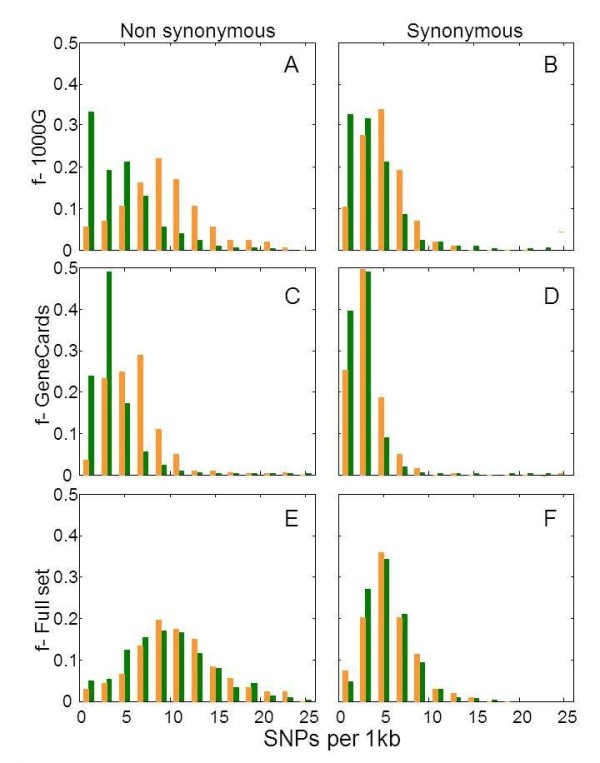
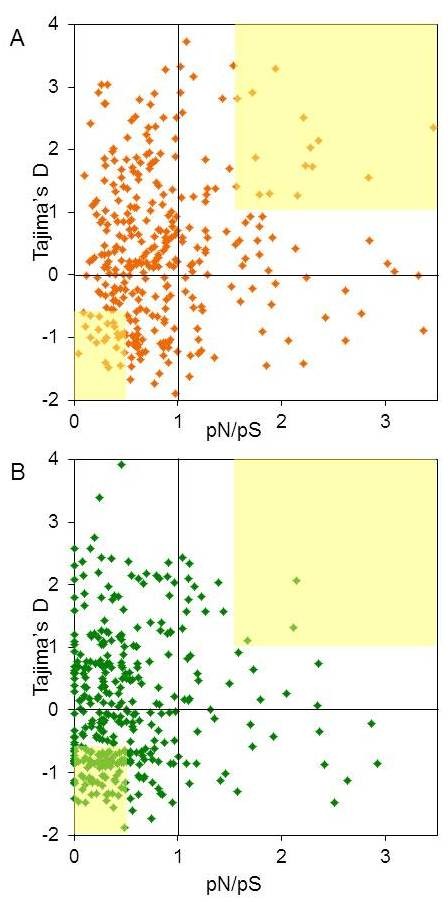
Results: By performing data-mining from public and private sources we scored genetic variations in 413 intact OR loci, for which one or more individuals had an intact open reading frame. Using 1000 Genomes Project haplotypes, we identified a total of 4069 full-length polypeptide variants encoded by these OR loci, average of ~10 per locus, constituting a lower limit for the effective human OR repertoire. Each individual is found to harbor as many as 600 OR allelic variants, ~50% higher than the locus count. Because OR neuronal expression is allelically excluded, this has direct effect on smell perception diversity of the species. We further identified 244 OR segregating pseudogenes (SPGs), loci showing both intact and pseudogene forms in the population, twenty-six of which are annotatively "resurrected" from a pseudogene status in the reference genome. Using a custom SNP microarray we validated 150 SPGs in a cohort of 468 individuals, with every individual genome averaging 36 disrupted sequence variations, 15 in homozygote form. Finally, we generated a multi-source compendium of 63 OR loci harboring deletion Copy Number Variations (CNVs). Our combined data suggest that 271 of the 413 intact OR loci (66%) are affected by nonfunctional SNPs/indels and/or CNVs.
Conclusions: These results portray a case of unusually high genetic diversity, and suggest that individual humans have a highly personalized inventory of functional olfactory receptors, a conclusion that might apply to other receptor multigene families.
Figures
Comment in
-
Different noses for different mice and men.BMC Biol. 2012 Aug 21;10:75. doi: 10.1186/1741-7007-10-75. BMC Biol. 2012. PMID: 22908960 Free PMC article.
Similar articles
-
Systematic inference of copy-number genotypes from personal genome sequencing data reveals extensive olfactory receptor gene content diversity.PLoS Comput Biol. 2010 Nov 11;6(11):e1000988. doi: 10.1371/journal.pcbi.1000988. PLoS Comput Biol. 2010. PMID: 21085617 Free PMC article.
-
High-resolution copy-number variation map reflects human olfactory receptor diversity and evolution.PLoS Genet. 2008 Nov;4(11):e1000249. doi: 10.1371/journal.pgen.1000249. Epub 2008 Nov 7. PLoS Genet. 2008. PMID: 18989455 Free PMC article.
-
The human olfactory transcriptome.BMC Genomics. 2016 Aug 11;17(1):619. doi: 10.1186/s12864-016-2960-3. BMC Genomics. 2016. PMID: 27515280 Free PMC article.
-
Human olfaction: from genomic variation to phenotypic diversity.Trends Genet. 2009 Apr;25(4):178-84. doi: 10.1016/j.tig.2009.02.002. Epub 2009 Mar 18. Trends Genet. 2009. PMID: 19303166 Review.
-
The human repertoire of odorant receptor genes and pseudogenes.Annu Rev Genomics Hum Genet. 2001;2:493-510. doi: 10.1146/annurev.genom.2.1.493. Annu Rev Genomics Hum Genet. 2001. PMID: 11701659 Review.
Cited by
-
Individual Differences in Thresholds and Consumer Preferences for Rotundone Added to Red Wine.Nutrients. 2020 Aug 20;12(9):2522. doi: 10.3390/nu12092522. Nutrients. 2020. PMID: 32825364 Free PMC article.
-
What Is the Relationship between the Presence of Volatile Organic Compounds in Food and Drink Products and Multisensory Flavour Perception?Foods. 2021 Jul 6;10(7):1570. doi: 10.3390/foods10071570. Foods. 2021. PMID: 34359439 Free PMC article. Review.
-
Characterization of Disease-Associated Mutations in Human Transmembrane Proteins.PLoS One. 2016 Mar 17;11(3):e0151760. doi: 10.1371/journal.pone.0151760. eCollection 2016. PLoS One. 2016. PMID: 26986070 Free PMC article.
-
From musk to body odor: Decoding olfaction through genetic variation.PLoS Genet. 2022 Feb 3;18(2):e1009564. doi: 10.1371/journal.pgen.1009564. eCollection 2022 Feb. PLoS Genet. 2022. PMID: 35113854 Free PMC article.
-
ORDB, HORDE, ODORactor and other on-line knowledge resources of olfactory receptor-odorant interactions.Database (Oxford). 2016 Oct 2;2016:baw132. doi: 10.1093/database/baw132. Print 2016. Database (Oxford). 2016. PMID: 27694208 Free PMC article.
References
Publication types
MeSH terms
Substances
Grants and funding
LinkOut - more resources
Full Text Sources
Molecular Biology Databases
